
Unbiased headlines. Facts, not spin.
Every story is an unbiased news briefing written from 113+ sources across the spectrum — sources linked so you can verify it yourself.
 finance
Notable (6/10)
Event date: September 14, 2026
finance
Notable (6/10)
Event date: September 14, 2026
Nasdaq Hit a Record Monday, But 30 S&P 500 Stocks Hit New Lows for Every 7 That Hit New Highs, a Split Not Seen Since 1999
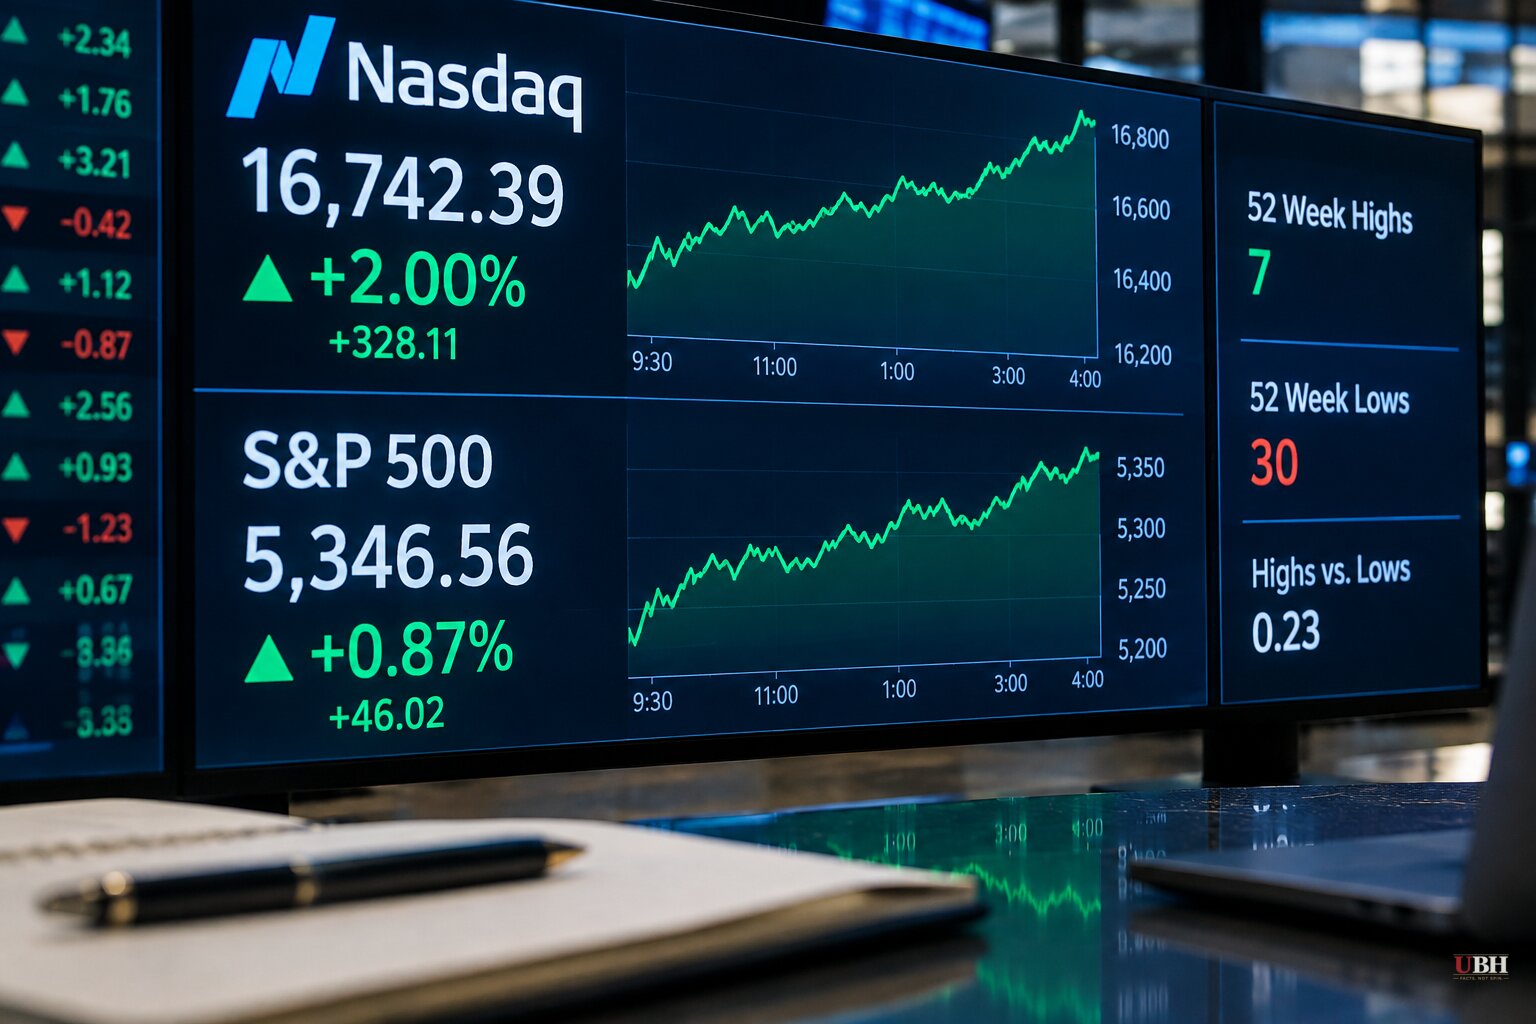
Stocks closed Monday, September 21, 2026, with the kind of headline numbers that make for good television. The Nasdaq Composite jumped 2% to a fresh record. The S&P 500 rose about 1.5% and sits less than 1% from its own all-time high, according to CNBC.
Below the surface, the picture was uglier. Thirty stocks in the S&P 500 fell to new 52-week lows on Monday. Only seven climbed to new 52-week highs, CNBC reported.
A Signal Last Seen Before the Dot-Com Top
That split matters because of how rare it is. Jason Goepfert, founder of SentimenTrader and now an adviser at NextGen News, told CNBC that the last time the S&P 500 rose at least 1% to within 1% of a 52-week high while new lows outnumbered new highs was December 21, 1999, a few months before the dot-com bubble peaked. Before that, according to Goepfert, the only other instance in history was July 23, 1929.
Two data points across nearly a century is a thin sample. Goepfert did not claim the pattern predicts a crash, and CNBC did not report him saying so. What he flagged is a mechanical fact about market breadth: gains concentrated in a shrinking set of winners while a growing set of stocks falls apart underneath them.
Art Hogan, chief market strategist at B. Riley Wealth, told CNBC the divergence comes down to which sectors are actually leading. Monday's advance was powered by communication services, information technology and consumer discretionary. Information technology sits under 1% from its own 52-week high, but communication services is 4% below its high and consumer discretionary is 7% below, Hogan said. In his words, "the creation of new lows has an easier glide path than the creation of new highs with today's leadership."
Hogan also tied the market's ceiling to specific, checkable conditions: he told CNBC the S&P 500 likely won't set fresh highs consistently if Middle East tensions persist, energy prices stay elevated and the Federal Reserve keeps hiking rates. Those are testable claims tied to oil prices and Fed policy decisions, not vague sentiment.
Valuations Are Already Near Dot-Com Levels
The breadth split isn't the only echo of 1999 showing up this month. Chris Neiger, writing for The Motley Fool via Yahoo Finance on September 14, 2026, reported that the Shiller cyclically adjusted price-to-earnings ratio for the S&P 500 has climbed to about 40, nearing the all-time high it hit in 1999 and far above its historic average of roughly 17. Neiger's piece noted the S&P 500 is up 70% over the past three years, the Dow is up 50%, and the Nasdaq has gained 89%, gains he attributed largely to AI-driven enthusiasm pushing valuations to levels rarely seen.
A high CAPE ratio isn't proof a crash is coming either. Neiger's own reporting cited JPMorgan Chase research showing that over the past two decades, the best response to a stretched valuation signal has typically been to do nothing rather than try to time an exit and a re-entry. Investors who sell on a valuation scare and guess wrong on the re-entry often end up worse off than if they'd stayed put. That's the strongest case against reading Monday's breadth numbers as a sell signal: two rare historical data points and one elevated ratio are pattern-matching, not a mechanism.
The SanDisk Case Study
Edward Chin, writing for the Epoch Times, offered a live example of what speculative excess looks like inside this rally. SanDisk (SNDK), spun off from Western Digital in February 2025 at roughly $35 to $36 a share, closed at a record $2,335 on June 25, 2026, up nearly 6,000% from its debut price. A $10,000 investment at the spinoff price would have grown to more than $650,000 at that peak, before fees and taxes, Chin reported. He attributed the run to genuine demand, tight NAND memory supply and AI data-center storage needs, not pure hype. But the Epoch Times headline on the follow-up piece, "From Market Darling to Bloodbath," signals the stock has since reversed hard. Chin used this example to argue investors should check how concentrated or leveraged their own portfolios have become before the next reversal, not just after one.
Chin also pointed out that September has historically been the S&P 500's weakest month, averaging about a negative 1% return, a distinction he drew against October's reputation for volatility rather than consistent losses.
What adds up is a specific, checkable list: a breadth divergence unseen since 1999, a CAPE ratio near 40, a single AI-storage stock that ran 6,000% and then reversed, and a market strategist's named conditions (Middle East tensions, energy prices, Fed rate policy) for whether new highs keep coming. Whether the Fed's next moves and oil prices break in Hogan's favor is the open question the market will answer in the coming weeks.
Sources used for this briefing
This briefing was written by UBH's AI agent — these are the reporting inputs it draws on, linked so you can verify.


