
Unbiased headlines. Facts, not spin.
Unbiased Headlines is an independently owned news organization. We bring you the facts, not opinions, written fresh from 110+ named sources. Sources linked so you can verify it yourself.
 energy
Major Story (7/10)
Event date: October 26, 2026 ·
Solar Now Out-Generates Nuclear Worldwide by 13%, BBC Analysis of Ember Data Finds
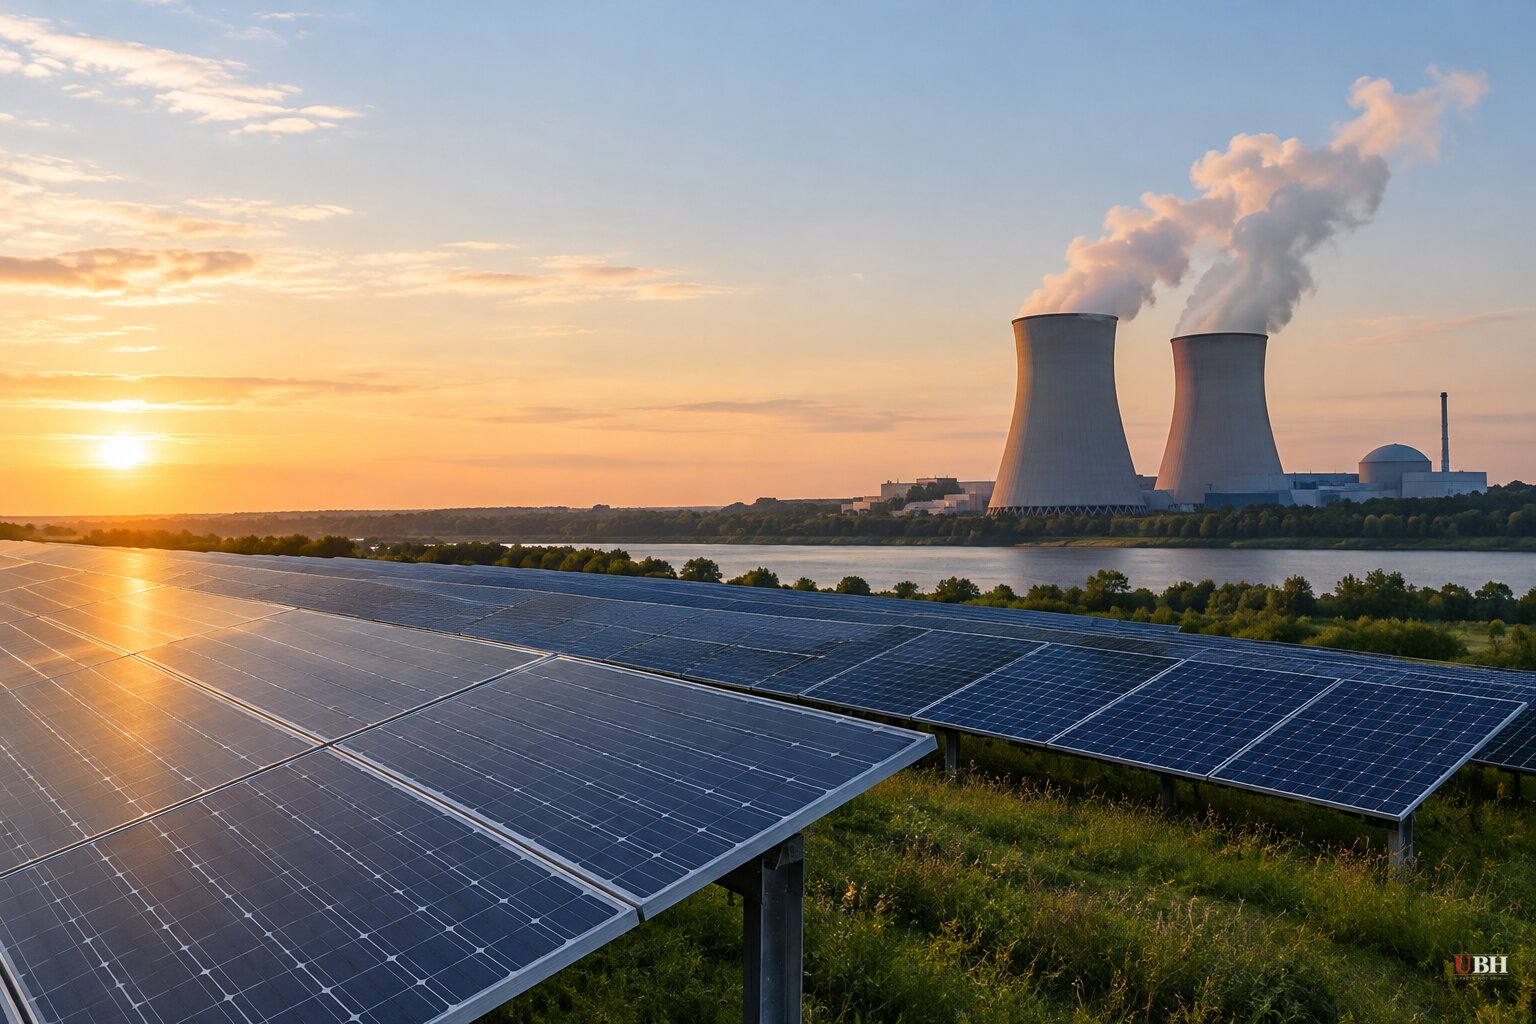
Solar power produced more electricity than the world's nuclear fleet in 2025, and the lead has grown since. A BBC analysis of data from the UK energy think tank Ember shows solar generating 13% more power than nuclear over the 12 months through September 2026. A year earlier the two were nearly tied.
The 2025 call was close. Ember's own data described solar as roughly level with nuclear that year. The World Nuclear Industry Status Report 2026, published Sept. 29, put solar ahead for the full calendar year. The report is an independent annual assessment overseen by French energy consultant Mycle Schneider, whose analyses have often questioned nuclear's prospects. Both sources agree on the direction.
How fast the gap opened
A decade ago solar supplied about 1% of the world's electricity. The BBC analysis says it will reach roughly 10% in 2026. Nuclear output has been essentially flat since 2000, while solar's has grown some 2,700-fold.
The monthly figures show the crossover coming. Wind out-generated nuclear worldwide in March 2025. Solar followed in April, the first month it did so. From March 2025 through June 2026, either solar or wind beat nuclear in every month. In March, April and May 2026, both did.
In June 2026, solar produced 326 TWh against 218 TWh for nuclear and 215 TWh for wind.
In 2025, solar met three-quarters of the growth in global electricity demand, overtaking wind as the largest source of new supply.
The nuclear side of the ledger
Nuclear plants generated 2,703 TWh in 2025, according to the WNISR. That is 8.8% of global electricity, the lowest share in about 45 years and roughly half the 1996 peak of 17.5%.
Nuclear output rose 1.1% last year. Solar generation jumped about 30%.
Installed solar capacity rose by 510 GW to 2,383 GW, a 27% increase. Wind added a record 159 GW to reach 1,291 GW. Installed nuclear capacity rose 1.5 GW to 399.5 GW, and operating capacity slipped 0.5 GW to 368.6 GW.
The WNISR solar figure may be low. Data from the International Energy Agency's photovoltaic program put 2025 solar additions near 690 GW, about 180 GW above the report's number.
China supplied nearly all of nuclear's growth. Its generation rose 7.6% in 2025, while output outside China fell 0.2%. Four reactors began generating power worldwide last year and seven shut down, the first net decline in reactor count since 2021.
The WNISR also found that none of the 16 reactors connected to the grid between 2023 and 2025 finished on schedule. Their average construction time was 10.9 years. Only four of 13 reactors slated to start in 2025 did.
Builders are not standing still. As of July 1, 2026, 73 reactors were under construction, the highest count since 1987, and China accounts for 37. Twelve construction starts in 2025 were the most since 2010.
What is driving solar
Price is the main answer. Solar became the cheapest electricity in history in 2020, Ember co-founder Dave Jones told the BBC, and a steep drop in panel prices in 2023 and 2024 pushed it further. "A panel in itself is just so unbelievably cheap," Jones said. "It's well under $100... and that's going to keep you generating electricity for 30, 40 years without any input at all."
Jan Rosenow, a professor of energy and climate policy at the University of Oxford, credits Chinese industrial scale. "Massive Chinese manufacturing scale and current overcapacity have pushed module prices to record lows," he said. That is a strategic dependency as much as a price story: the cheapest panels on earth come overwhelmingly from one country.
Rosenow said the International Energy Agency's projections "assumed linear growth and slowly falling costs, and got both wrong."
Storage is helping. Rosenow said batteries "have largely solved the daily problem of shifting midday sun into the evening." Grid-scale storage connected in 2025 totaled 104 GW and 257 gigawatt-hours, according to the WNISR.
Higher diesel prices have added to the pull, the BBC reported, tied to the Russia-Ukraine war and the US-Israel war with Iran. In Pakistan, solar went from under 2% of electricity in 2019 to 24% now. Jones noted much of that buildout was paid for out of pocket rather than with loans. African countries install roughly 100,000 panels a day, and India met 60% of its new power demand with solar over the past two years.
The U.S. and the limits of the comparison
The United States remains the second-largest solar installer despite tariffs. Alicia Zhao, a University of Maryland expert on U.S. mitigation pathways, said tariffs and other federal policies "are certainly expected to raise costs and slow expansion." She added that "even with rising costs, solar is still one of the cheapest sources of new power in the US. And it is getting built regardless of political lines."
An annual generation tally does not make the two sources interchangeable. Solar output varies with time of day, season and weather. Nuclear plants are built to run steadily around the clock. The comparison measures deployment speed, not equivalent grid function, and the batteries that bridge that gap are still a small fraction of the installed solar fleet.
Ember's Jones sees solar's reach extending beyond power. "That's where solar's going, to not just be king of electricity, but king of energy," he told the BBC.
The BBC analysis says solar will almost certainly extend its lead over nuclear through the rest of 2026. Complete 2026 generation figures and the next annual WNISR will show whether the 13% gap holds and how much of nuclear's 73-reactor construction pipeline reaches the grid.
Sources used for this briefing
7 links from 7 independent newsrooms (syndicated copies of the same report count once)
These are the sources it draws on, linked so you can verify.