
Unbiased headlines. Facts, not spin.
Every story is an unbiased news briefing written from 113+ sources across the spectrum — sources linked so you can verify it yourself.
 finance
Notable (6/10)
October 5, 2026 at 04:18 AM
finance
Notable (6/10)
October 5, 2026 at 04:18 AM
84% of Nifty 50 Stocks Fall Below Their 200-Day Average as Indian Markets Lose $250 Billion in Seven Weeks
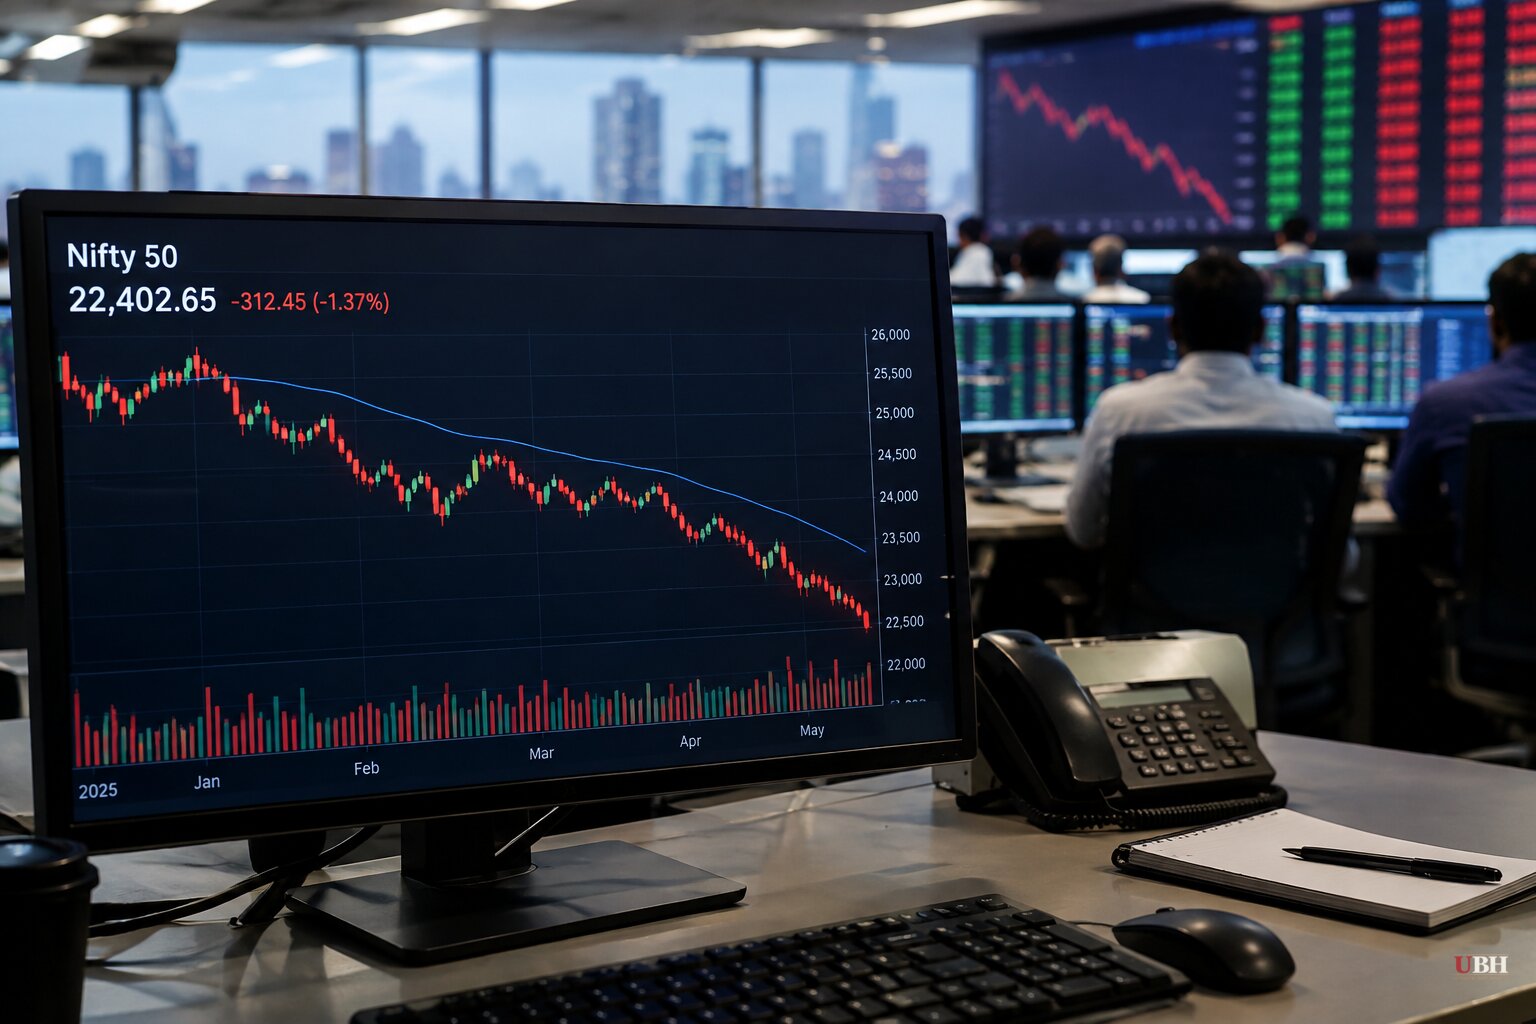
Since foreign portfolio investors dumped ₹25,682 crore in Indian stocks in September while still putting $1 billion into fresh IPOs, as reported October 4, the broader market has kept sliding and the damage has spread well beyond headline index levels.
As of this week, 42 of the 50 stocks in the Nifty 50, or 84%, are trading below their 200-day moving average, according to the Economic Times. That is a key technical threshold investors use to judge whether a stock is in a long-term uptrend or downtrend.
It is not just large caps. In the broader Nifty 500 index, 310 stocks, or 65%, are also below their 200-DMA, Career Ahead Online reported, citing the same Economic Times data.
Seven Weeks Down, an Eighth on Deck
The Nifty 50 has now fallen for seven consecutive weeks, according to Bloomberg reporting published by LiveMint, wiping out nearly $250 billion in market capitalization. The index is down 2.3% this week and on track for an eighth straight weekly decline, which Bloomberg says would be its longest losing streak since the end of the dot-com bubble era.
More significantly, the Nifty 50 broke below its 200-week moving average on a weekly basis for the first time since March 2020, per Bloomberg. That is a six-year-old support level. The 30-stock BSE Sensex breached the same weekly support a week earlier.
What's Actually Driving This
Bloomberg's reporting, via LiveMint, attributes the selloff to a convergence of pressures rather than one single cause. India's heavy reliance on oil imports means rising crude prices threaten to stoke inflation and cloud the growth outlook. A global bond yield rally is making Indian equities look less attractive by comparison, pushing foreign investors to pull even more money out. Global fund managers have increasingly downgraded Indian stocks for lacking meaningful exposure to the AI trade that has driven returns elsewhere.
Foreign investors have withdrawn close to $26 billion from Indian stocks so far this year, Bloomberg reports. A weakening rupee is compounding the problem by eroding the dollar-denominated returns those investors get, which fuels still more selling.
Adding to the pressure, an Economic Times poll of economists finds the Reserve Bank of India is likely to raise its repo rate by 25 basis points to 5.50% when it meets this month for its October policy decision. A rate hike would tighten domestic liquidity further at a moment when foreign capital is already heading for the exits.
The Bull Case Nobody Should Ignore
Breaking a six-year support level on the back of persistent, broad-based selling across 84% of the large-cap index is not a minor technical wobble. Yet the selloff has also pushed valuations to their cheapest relative to earnings estimates since 2020, according to Bloomberg's reporting. Analysts cited by CNBC-TV18, per Career Ahead Online, say the market may be nearing a bottom, which could present a buying opportunity for investors willing to do the legwork rather than chase the panic.
Analysis attributed to Our Money Now suggests portfolio managers may need to rethink their heavy weighting toward large caps, since small- and mid-cap stocks have held up better and kept their long-term trends intact despite the broader rout. That is a real divergence worth watching: a market where nearly every blue-chip name is technically broken, but smaller stocks are not telling the same story.
History offers some support for the patient case too. Major selloffs of this breadth have often preceded recoveries in the past, though past patterns are not a guarantee, and nobody quoted in this reporting claims otherwise.
What Happens Next
Two concrete events will test both arguments. The RBI's October rate decision will show whether the central bank prioritizes inflation control over supporting a falling equity market. India's Q2 corporate earnings season, which the Economic Times has flagged as a pivotal moment, will either confirm the market's pessimism about growth or give bulls the evidence they need to call this a bottom. Until one of those lands, the fight between the technical chart and the valuation argument stays unresolved.
Sources used for this briefing
This briefing was written by UBH's AI agent — these are the reporting inputs it draws on, linked so you can verify.


