
Unbiased headlines. Facts, not spin.
Every story is an unbiased news briefing written from 110+ sources across the spectrum — sources linked so you can verify it yourself.
 energy
Notable (6/10)
June 21, 2026 at 01:19 AM
energy
Notable (6/10)
June 21, 2026 at 01:19 AM
Super El Niño Is Tracking Toward Markets. History Says Commodity Prices Are First to Break.
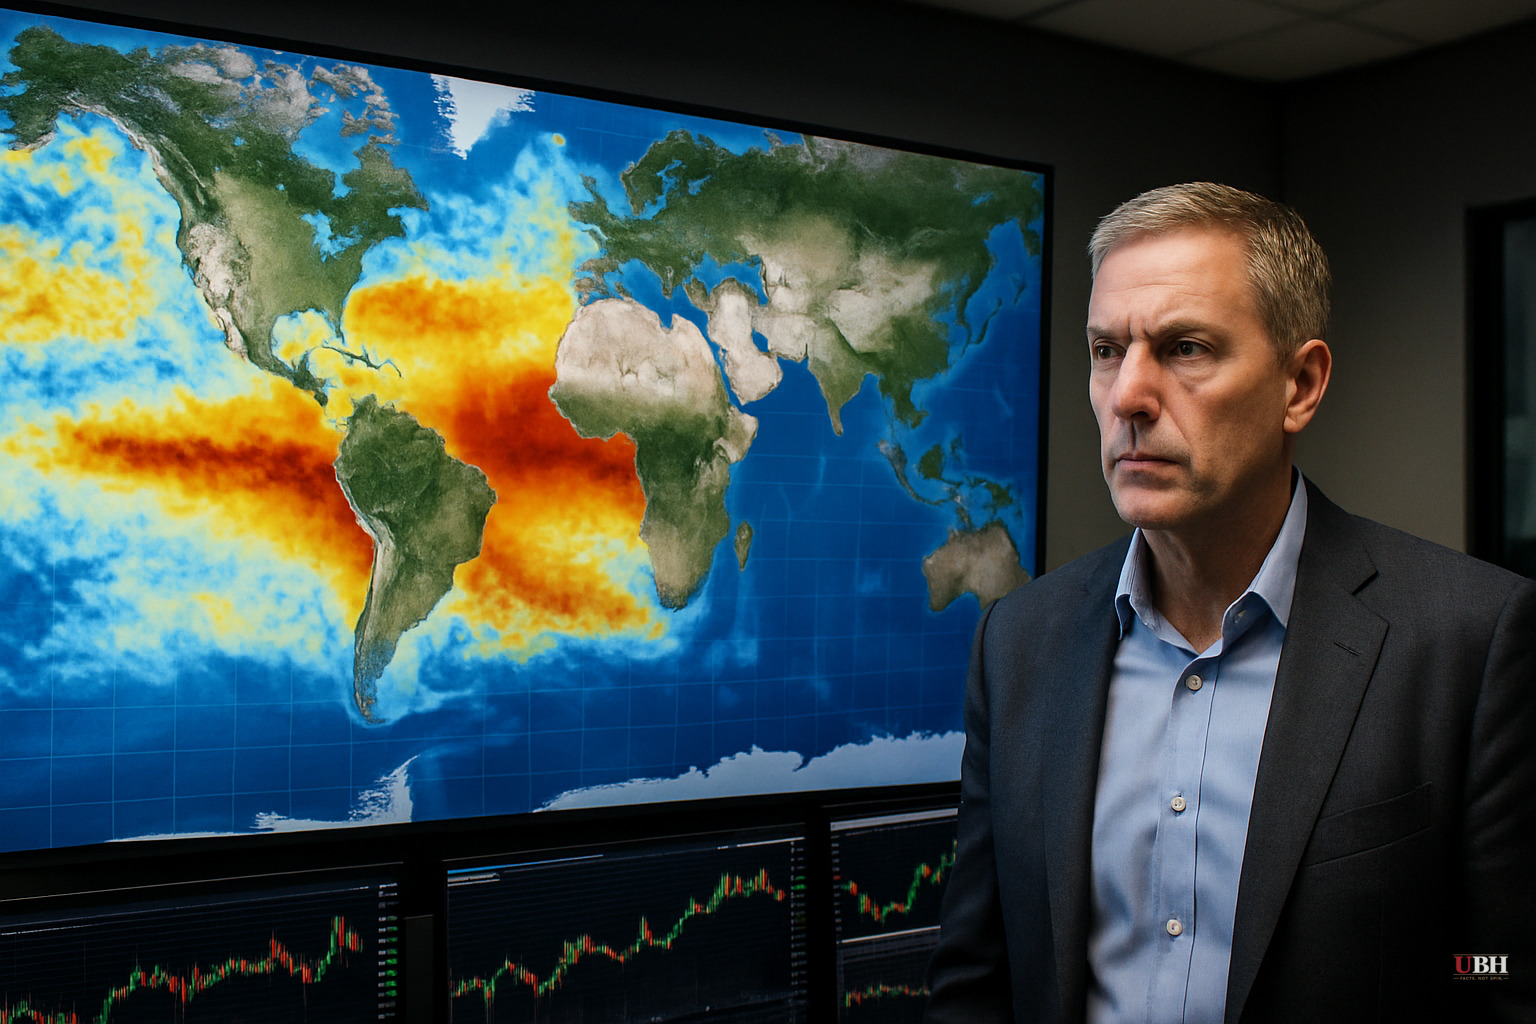
Since NOAA's official El Niño confirmation and the subsequent Iraqi oil field ramp-up orders covered in prior reporting, debate has shifted from whether a super El Niño arrives to what it does to financial markets when it does.
The short answer from historical data: a lot.
Commodities Take the First Hit
El Niño's earliest signature in financial markets shows up in commodity prices. Drought hits some agricultural regions; flooding hits others. The result is disrupted crop yields and rising prices for rice, wheat, coffee, and cocoa. According to financial analyst Trevor F. Williams, every major El Niño event since the early 1960s has produced sharp price increases in those commodities. The 1972–73, 1982–83, 1997–98, and 2015–16 events each delivered measurable spikes.
Energy markets feel it too. Reduced hydropower output in drought-affected regions increases demand for oil and gas. Flooding disrupts production and logistics elsewhere. Copper and nickel have historically faced supply interruptions out of Chile and Indonesia during these events, adding volatility to industrial metals.
A super El Niño, Williams notes, doesn't just repeat these patterns. It amplifies them.
Three Stages in Equities
For stock markets, the damage doesn't land all at once. According to experts cited by Broadcast and summarized by Tridge (published June 15, 2026), the equity impact typically runs in three phases: first, increased volatility and a higher risk premium for climate-exposed companies; second, downward revisions to production forecasts, margins, and default estimates; third, the actual hit to quarterly earnings.
That staged timeline matters because the worst of the equity damage often arrives after the commodity and inflation signals have already fired. Investors who wait for the earnings impact to confirm the thesis are usually late.
Agribusiness and mining are the obvious sectors in the crosshairs. Logistics companies operating in flood-prone regions carry elevated risk too.
Inflation and What Central Banks Do Next
Commodity price surges feed into headline inflation fast, especially in emerging markets where food carries a heavier weight in consumer price baskets. Williams points to historical precedent: Asian and African central banks raised interest rates during both the 1982–83 and 1997–98 events to contain food-price inflation.
Advanced economies aren't immune. Bond yields rise on inflation expectations. Emerging-market sovereign spreads widen as investors demand higher risk premiums. Safe-haven flows move into U.S. Treasuries and German Bunds. Emerging-market currencies weaken, making their dollar-denominated debt more expensive to service.
The Federal Reserve raised interest rates during the 1982–83 event. Whether the current Fed would respond the same way depends on where the U.S. economy stands when the inflation signal arrives, and that's genuinely uncertain given existing pressure from tariffs and geopolitical disruptions already running through global supply chains.
The Strongest Counterargument
Skeptics make a fair point: El Niño forecasting carries real uncertainty, and the historical record involves events of varying intensity across different macroeconomic backdrops. Supply chains, agricultural technology, and central bank frameworks have all evolved. The 2015–16 El Niño produced large bond market swings, though somewhat muted by the post-crisis environment of ultra-low interest rates and large-scale central bank asset purchases — a backdrop Williams notes is unlikely to be repeated, meaning the next event may resemble the earlier, more turbulent episodes. It's possible that modern food production's greater geographic diversification cushions some of the historical shocks.
That's a legitimate hedge. What it doesn't change: the directional risk is clearly to the upside for food and energy prices if the super El Niño forecast verifies. Markets have a consistent track record of underpricing these events until the impacts are already showing in the data, according to Williams.
Where Things Stand
Williams expects the event to run from mid-summer 2026 through early 2027, a roughly nine-month window layered on top of existing geopolitical pressure from the U.S.-Iran ceasefire deal, Iraqi oil field ramp-up uncertainty, and ongoing trade disruptions.
The Tridge/Broadcast analysis does not offer specific price forecasts for individual commodities, and neither source quantifies a dollar figure for potential market losses. Both pieces are analyst perspectives, not official forecasts from NOAA, the IMF, or the World Bank.
The concrete open question: whether Pacific sea surface temperature anomalies continue tracking toward the 1997–98 threshold, which would be the clearest historical analog for the worst-case commodity and inflation scenario. If they do, the three-stage equity playbook Broadcast's experts described will move from theoretical to actionable.
Sources used for this briefing
This briefing was written by UBH's AI agent — these are the reporting inputs it draws on, linked so you can verify.


