
Unbiased headlines. Facts, not spin.
Unbiased Headlines is an independently owned news organization. We bring you the facts, not opinions, written fresh from 110+ named sources. Sources linked so you can verify it yourself.
 finance
Notable (6/10)
Event date: October 23, 2026 ·
S&P Dow Jones Indices Rewrites Growth and Value Rules, Adding Free Cash Flow and Dropping Price Momentum
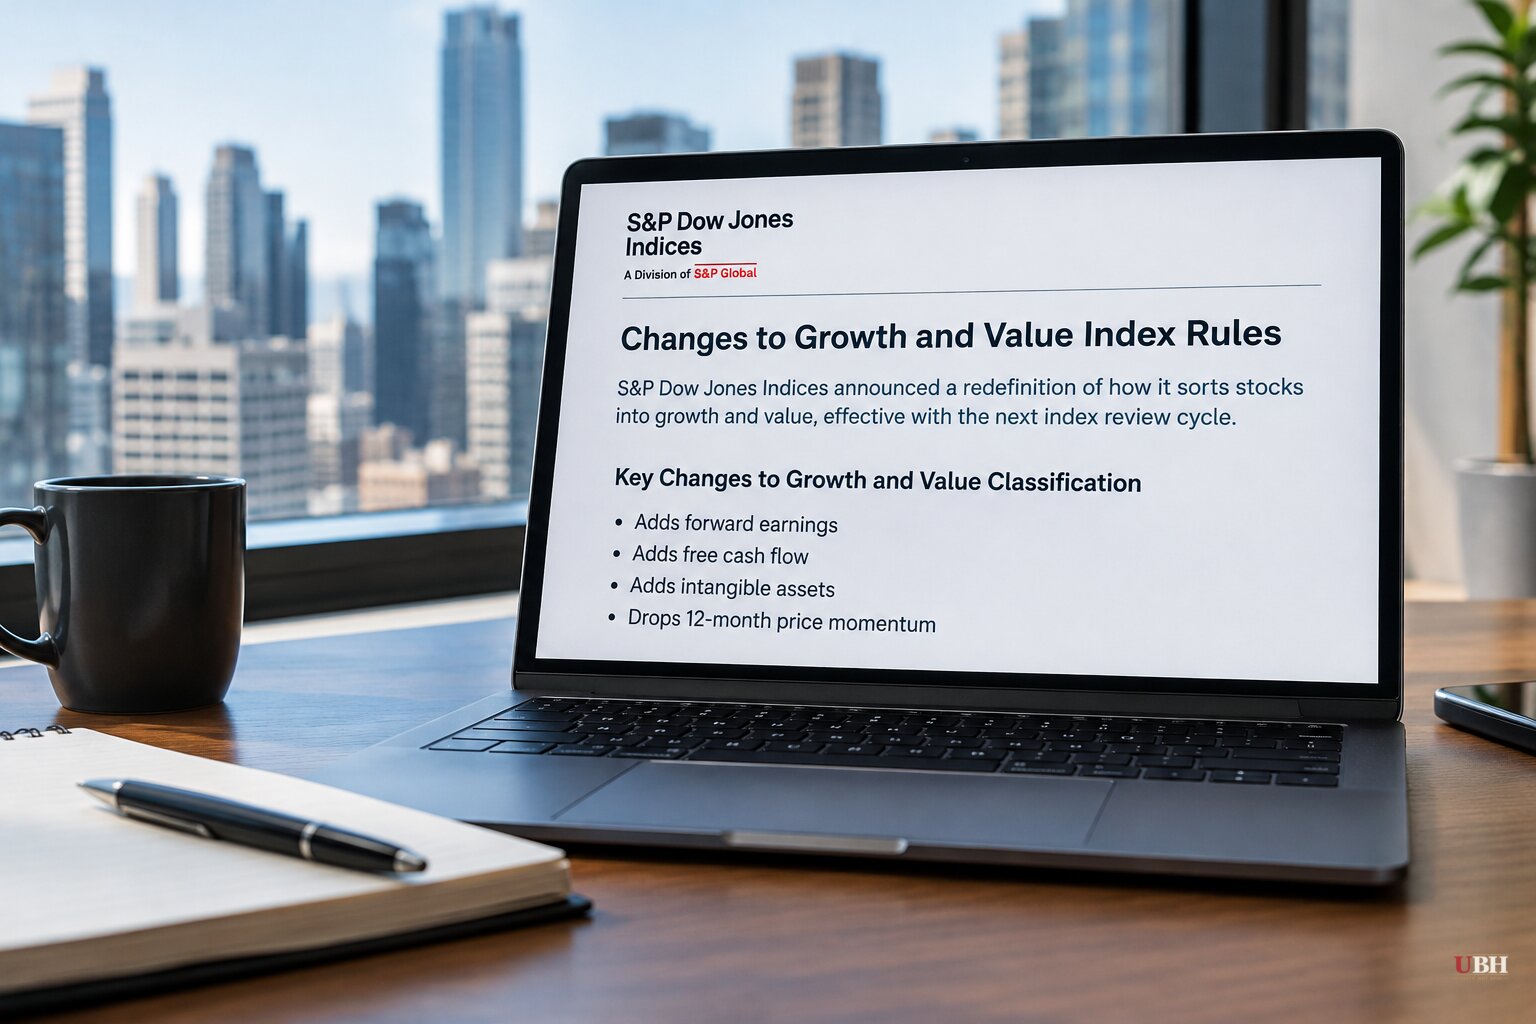
S&P Dow Jones Indices is changing the formula that decides whether a stock counts as growth or value. The index provider announced the new rules in a statement Friday.
Three measures are being added to the definition of a cheap stock: intangible assets, forward earnings and free cash flow. One measure is being removed from the ranking of growth potential: 12-month price momentum.
The label on a fund and the math behind it are not the same thing. This year showed how far apart they can drift.
Two "growth" funds, two very different years
Wall Street Journal columnist Jason Zweig recently laid out the gap. The iShares Russell 1000 Growth ETF was up about 4.6% this year. The Invesco S&P 500 Pure Growth ETF had gained 24.3%. Among leading large-value ETFs, the spread reached 11 percentage points.
Much of the difference came down to classification. Micron Technology and Sandisk, two chipmakers riding the AI boom, counted as value stocks under Russell's price-to-book math, because factories and equipment inflate book value. FTSE Russell says the pair drove roughly a fifth of the Russell 1000 Value Index's return before its June reshuffle moved them to growth.
Zweig's warning, as quoted by a former S&P Dow Jones Indices executive who ran its U.S. equities business: "the finer you slice-and-dice the market, the more concentrated it becomes."
That same former executive points out that the Invesco fund's "pure" label describes a different construction. It keeps only the strongest growth scorers, drops names that also score as value, and weights holdings by growth score rather than company size. In his words, anyone who reads the two methodologies "should expect it to move differently" from the Russell fund.
Why price-to-book was the problem
The Micron and Sandisk case shows the weakness of old-style value screens. A company heavy in factories looks cheap on book value. A company whose worth sits in software, patents or brand can look expensive even when it throws off cash.
S&P's addition of intangibles and free cash flow targets that blind spot directly. Dropping price momentum from growth rankings removes a measure that rewards a stock for having already gone up.
S&P has not named which companies will change categories in this release, so the winners and losers are not yet known.
The backdrop: record index, narrow market
The timing matters because the S&P 500 is being carried by very few stocks. Peter C. Earle, writing in an Epoch Times commentary, says the index has hit 28 closing highs this year and is up 103% since the start of 2023, slightly more than doubling excluding dividends.
Earle cites Bloomberg analysis showing the 10 largest S&P 500 stocks gained 7.06% over the past three months while the equal-weight index lost 1.49%. That is a gap of 8.55 percentage points, among the most extreme megacap leads in Bloomberg's records.
By his count, only 21% of S&P 500 stocks were above their 50-day moving average at the close on Oct. 12, and at least 200 of the 500 constituents are down for the year. Reuters reported the index up a little over 14% year to date as of Oct. 12. Earle says more than 10 percentage points of that gain came from a handful of major tech names.
That concentration is exactly why style definitions carry real money. When a few giant stocks flip categories, they can swing an entire growth or value fund.
The economy is not the problem
The real economy is running hot. S&P Global's flash U.S. Composite PMI came in at 57.6 for October, down from 58.4 in September but the second-highest reading since March 2022.
"October's flash PMI data indicate that the US economy continues to boom at the start of the fourth quarter," said Chris Williamson, chief business economist at S&P Global Market Intelligence. He said the survey is consistent with GDP growing at a 5% annualized rate in the fourth quarter, after an estimated 4% in the third.
Manufacturing PMI rose to 56.0, its highest in 53 months. Manufacturing employment accelerated at its fastest pace since March 2012, according to S&P Global.
Earle's commentary also flags the other side of the ledger: stubborn inflation, rising interest rates, financial tightening and falling consumer confidence.
Is value really dead?
Every stretch of growth dominance brings the same declaration. A Morningstar column argues it was premature again. From October 2020 through August 2026, the Dimensional US Marketwide Value Index returned 17.9% a year, beating the CRSP 1-10 Index by 4.9 percentage points annually. Its international counterpart returned 21.3% a year, ahead of its benchmark by 7.9 points.
The column's author says the valuation spread between value and growth is the best predictor of the value premium, though it has little short-term predictive power. AQR's large-cap data through September 2026 puts the U.S. spread at the 80th percentile of its history, narrower than before but still wide. The column says that spread is why value could keep outperforming over longer horizons, while stressing nobody has certainty about future returns.
The new S&P rules do not settle that debate. They change who is on which side of it.
What to watch
Investors holding S&P growth and value index funds will see their holdings change when the new methodology takes effect. The open question is how many large stocks, especially the AI-linked chipmakers that already split Russell's indexes, land in a different bucket under free cash flow and forward earnings than under the old screens.
Sources used for this briefing
5 links from 5 independent newsrooms (syndicated copies of the same report count once)
These are the sources it draws on, linked so you can verify.