
Original briefings. Zero spin.
Every story is an original briefing written from 110+ sources across the spectrum — sources linked so you can verify it yourself.
 finance
Notable (6/10)
Event date: September 6, 2026
finance
Notable (6/10)
Event date: September 6, 2026
Oil Spike Pushes 10-Year Yield Toward 5% as S&P 500 Slides to 7,666 Ahead of Fed Decision
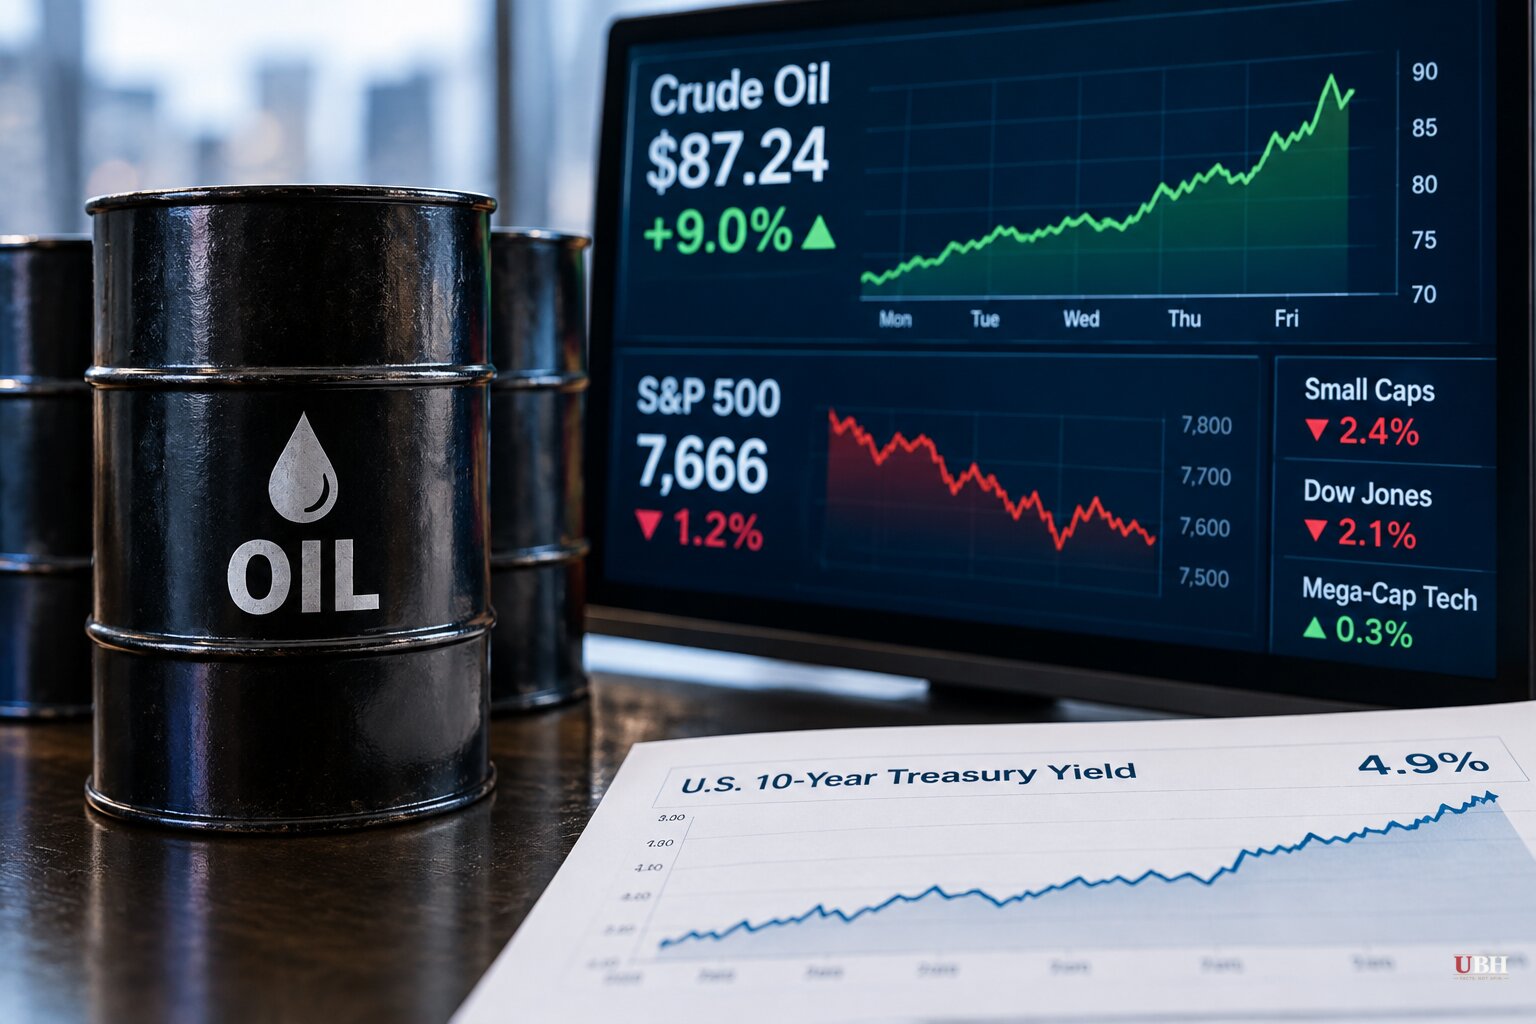
The S&P 500 closed the week at 7,666, down 0.68%, according to Lance Roberts of RealInvestmentAdvice.com. That headline number undersells what actually happened underneath.
Small caps fell 2.38%. The Dow dropped 1.51%. The equal-weight S&P 500, which strips out the mega-cap distortion, gave up 1.87%. The cap-weighted index lost less than a point, and the Nasdaq-100 barely budged, down 0.52%, according to Roberts. When the average stock falls three times harder than the index that supposedly represents it, the market is running on fewer and fewer names.
Crude oil is the reason. Oil rose roughly 9% over four sessions, and TheStreet tied part of that move directly to Middle East escalation, which lifted the S&P's Energy sector 1.0% during the September 8 session while broader markets fell. That climb pulled the 10-year Treasury yield up with it, closing the week just under 5%, per Roberts.
Rate-sensitive sectors paid the price. The iShares US Home Construction ETF fell 3.1% on September 8 alone, according to TheStreet. Travel and lodging stocks, exposed to fuel costs, got hit too: Expedia Group fell 6%, Booking Holdings fell 5%, and Tripadvisor and Airbnb each dropped about 3%.
Inflation data gave the bond market its excuse
Headline CPI ran at 3.4% year-over-year, with core CPI holding at 2.4%, just above the Federal Reserve's target, Roberts reported. Producer prices told a sharper story: PPI jumped 0.4% for the month, and the annual rate accelerated to 5.4% from 4.8%. Core producer prices came in at 4.6%. Diesel alone leaped 24%.
Roberts argues that reading is an oil shock, not evidence of an overheating economy, and that the Fed has no clean justification to hike into it, particularly with a softening labor market. Even so, he notes the market is still leaning toward a quarter-point hike when the Federal Open Market Committee meets Tuesday and Wednesday, September 15-16.
Semis and fiber deals kept losses from spreading
Not everything sold off. The PHLX Semiconductor Index rose 1.3% on September 8 even as Nvidia lagged, down 2.0%, according to TheStreet. Intel jumped about 9% on positive analyst commentary and reports of price increases. AMD gained roughly 6% on AI-demand and server-CPU commentary. Qualcomm added about 3% on a multi-year deal with Amazon for custom silicon and optical connectivity.
Optical names ran hardest on a multibillion-dollar fiber agreement between Corning and Verizon covering more than 80 million miles of fiber from 2027 through 2032. Corning rose 7.6%, Lumentum 11%, and Coherent 7.1%, per TheStreet. Health Care was the session's worst performer, down 2.6%, dragged by an Amgen plunge tied to clinical-trial setbacks at Novartis, whose shares separately fell about 14%.
The bigger argument: is the earnings boom real?
Zoom out, and Wall Street is fighting over whether corporate earnings themselves are breaking a near-century-old pattern. Jim Reid of Deutsche Bank Research found that S&P 500 earnings per share have historically grown around 6.5% annualized between 1935 and 2019, according to a note covered by TradingView. Current EPS growth is surging well above that channel, driven largely by AI-related spending.
Reid's caution: EPS numbers are inflated by decades of stock buybacks shrinking share counts, and raw corporate profits have actually grown slower than EPS over the past 60 years. His framing, as quoted by TradingView, is blunt. Either AI produces a sustainable earnings breakout no prior technology managed, or the market is watching a capex-driven earnings bubble inflate in real time.
Bear case vs. not-yet case
Danish economist Henrik Zeberg told Business Insider he expects the Nasdaq 100 to climb as high as 39,000 by late 2026 in a final blow-off top before crashing back to around 10,600, its 2022 trough, by the end of 2027. That would represent a 72% decline he compares to the dot-com collapse. Zeberg points to a labor force participation rate at a 50-year low as of July and a long-term unemployment rate of 27% of all unemployed workers as of August, per Bureau of Labor Statistics data cited by Business Insider, arguing that headline job growth of 162,000 in August masks a weaker underlying economy. He also flagged that federal data last year showed 911,000 fewer jobs were added between April 2024 and March 2025 than initially reported, and speculated further revisions could erase more of the recent hiring numbers.
Zeberg's recession call is built on a model that, according to Business Insider, correctly flagged the 2020 downturn and correctly dismissed 2022 recession fears. It is not a proven outcome, and the Atlanta Fed's own GDPNow estimate points the other direction, projecting third-quarter growth accelerating to 4.7%.
Jim Welsh, publisher of Macro Tides, takes the opposite near-term view. Speaking on Chuck Jaffe's Money Life podcast on September 9, Welsh said the New York Stock Exchange advance-decline line keeps making new highs, which historically has preceded major tops rather than accompanied them. He's watching for a pullback toward the 7,300 level on the S&P 500, potentially down to 7,100, over the next two months, and says his two real risks are oil above $100 a barrel and the 10-year Treasury reaching 5%. Welsh isn't calling AI a bubble yet either, noting AI spending is only about 1.7% of GDP against a federal deficit running near 6% of GDP, though he does expect semiconductor stocks to eventually face what he called "another 60% correction," echoing the 65% drop chips suffered in the 2001-02 bear market.
Both Zeberg and Welsh agree a secular bear market is coming eventually. They disagree sharply on timing, and neither has a crystal ball the other lacks.
The next concrete data point arrives Tuesday and Wednesday, September 15-16, when the Fed announces its rate decision. Roberts' own read is that the central bank has no clean case to hike into an oil-driven inflation spike paired with a softening jobs picture, but the market is pricing a hike anyway. Whether oil keeps climbing and the 10-year actually breaks 5% will determine whether the narrow group of stocks still holding this market up keeps holding, or gives way first.
Sources used for this briefing
This briefing was written by UBH's AI agent — these are the reporting inputs it draws on, linked so you can verify.


