
Unbiased headlines. Facts, not spin.
Unbiased Headlines is an independently owned news organization. We bring you the facts, not opinions, written fresh from 110+ named sources. Sources linked so you can verify it yourself.
 economy
Notable (6/10)
Houston Study: Homes on the Same Street Face Very Different Flood Risk, and FEMA Maps Don't Show It
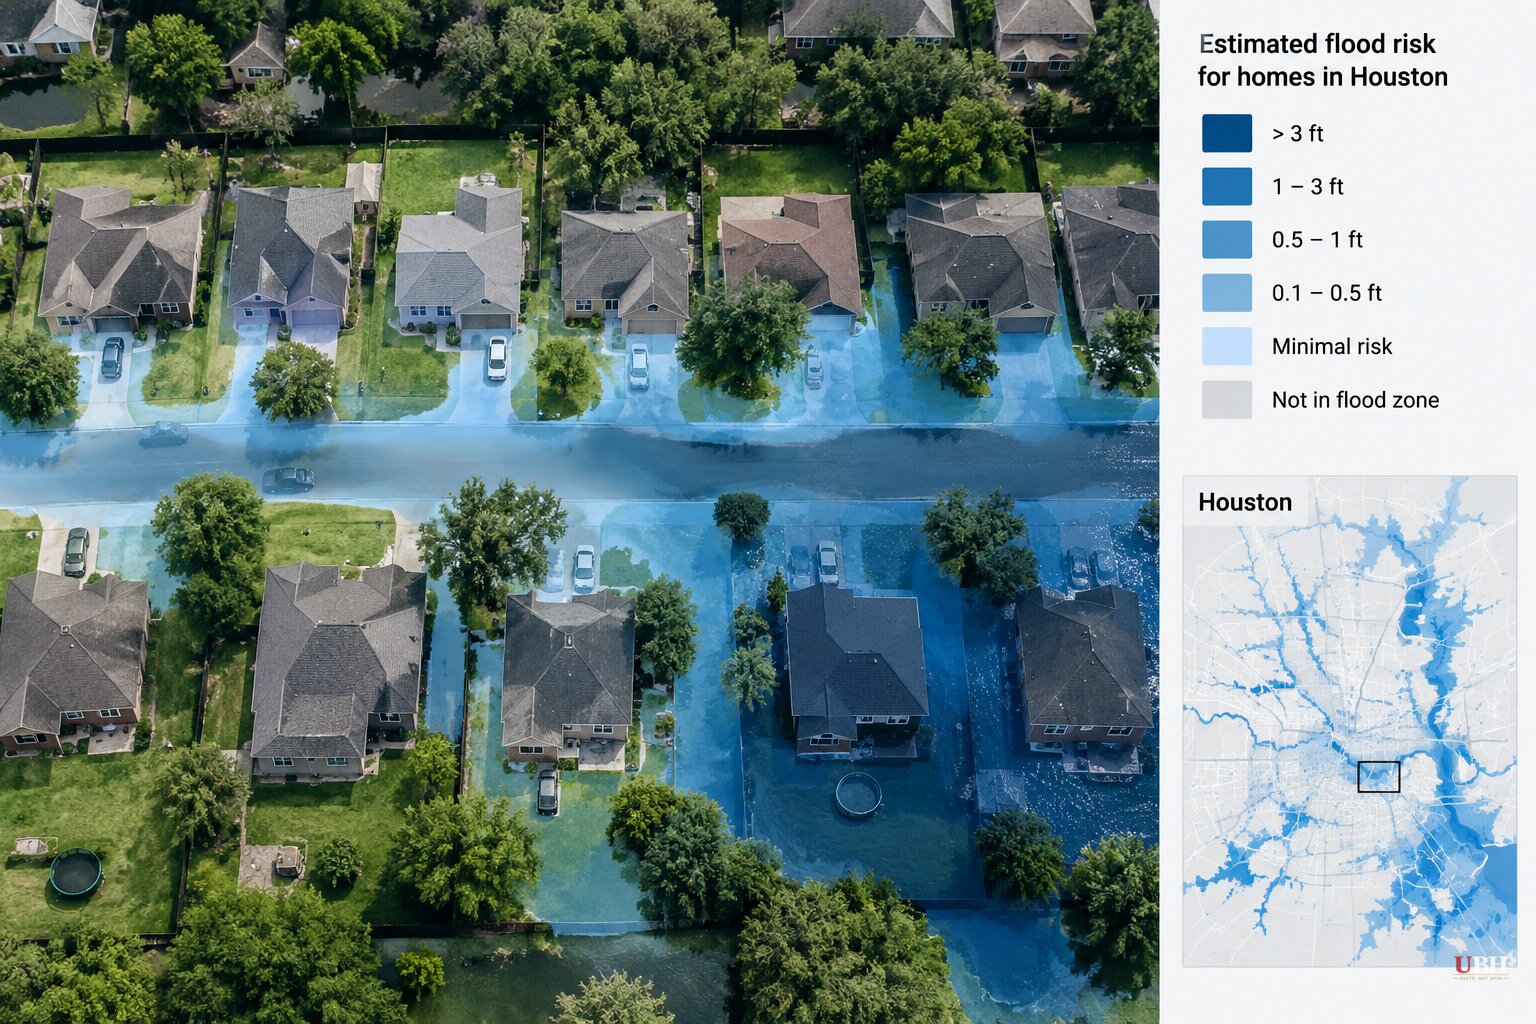
FEMA's flood maps tell you one thing: whether water is likely to reach your neighborhood. They say nothing about what happens to your house when it does.
That is the finding behind a study in the journal Applied Geography by Yilei Yu, Dylan Connor, James R. Elliott, Aaron Flores of Arizona State University and Sara Meerow of the University of Colorado Boulder. The team built a flood vulnerability score for nearly 1 million homes in Houston and Harris County.
The maps and their limits
The researchers cite an estimate that significantly more homes face flooding than FEMA's 100-year flood maps show. By that estimate, about 6 million more homes are at risk, for 14.6 million properties in all.
A 100-year flood is one with a 1% chance of occurring in any given year.
The authors say the official maps are commonly outdated, and some are two decades old. Even updated maps typically rely on historical flood data, not projections of future risk.
The practical problem is that a home outside the mapped zone can look safe on paper. No one requires its owner to buy flood insurance, and the map suggests there is nothing to worry about.
Standard homeowners policies in the United States mostly do not cover flood damage, the authors note. A family that skips flood coverage because the map cleared them is exposed.
What the Houston data showed
The researchers combined four kinds of information for each home: likely flood depth, the age and condition of the building, congestion on surrounding roads, and financial factors including repair costs and how common flood insurance is.
They found the vulnerability indicators vary more among individual homes inside the same neighborhood than they do between neighborhoods on average.
The authors describe how that plays out on one street. A newer, well-maintained house with flood insurance sits next to an older one at the low end of the block, where water runs deeper, that is in poor repair and uninsured. Same storm, very different recovery.
Their earlier Houston research found that more than half of 100,000 documented flood-prone buildings in the city lie outside official flood boundaries. Those buildings are more likely to be in poor condition and uninsured.
The authors say redrawing the lines would not fix this on its own. Better maps would still not capture a single home's depth, condition or coverage.
What the authors propose
The researchers argue neighborhood averages make it hard to tell which homes will be hit hardest. That matters to owners deciding how to protect a house, and to local officials deciding where limited flood-protection money should go.
Their proposal: communities should pair address-level risk data with local information about homes, roads and insurance, and use it to find the dwellings most in need of protective measures.
That is a local-government approach, not a call for a bigger federal program. The authors frame it as a way to spend scarce dollars on the properties where a flood would do the most damage. It also puts responsibility with the people closest to the problem, which is where most of this spending is decided anyway.
Limits of the study
The vulnerability score was built for Houston and Harris County. The 6 million and 14.6 million national figures are described by the authors as coming from one estimate, not from their Houston work.
The authors do not claim their four-factor score has been adopted by any city or by FEMA. Whether other communities build similar address-level tools, and whether FEMA changes how it maps risk or updates maps that are two decades old, has not been announced.
Sources used for this briefing
5 links from 4 independent newsrooms (syndicated copies of the same report count once)
These are the sources it draws on, linked so you can verify.