
Unbiased headlines. Facts, not spin.
Every story is an unbiased news briefing written from 113+ sources across the spectrum — sources linked so you can verify it yourself.
 energy
Notable (6/10)
Event date: September 25, 2026
energy
Notable (6/10)
Event date: September 25, 2026
US Solar Nears 300 GW as Growth Rate Cools to 22%, With Red States Leading the Buildout
The growth rate is cooling, not collapsing
US electricity demand rose 2% in the first seven months of 2026 compared to the same stretch in 2025, according to Ars Technica's grid-data tracking, down from a 3% increase the year before. That's happening even as data centers, EVs, and heat pumps keep pulling more power onto the grid, which Ars attributes partly to efficiency gains and to data centers increasingly generating their own power off-grid.
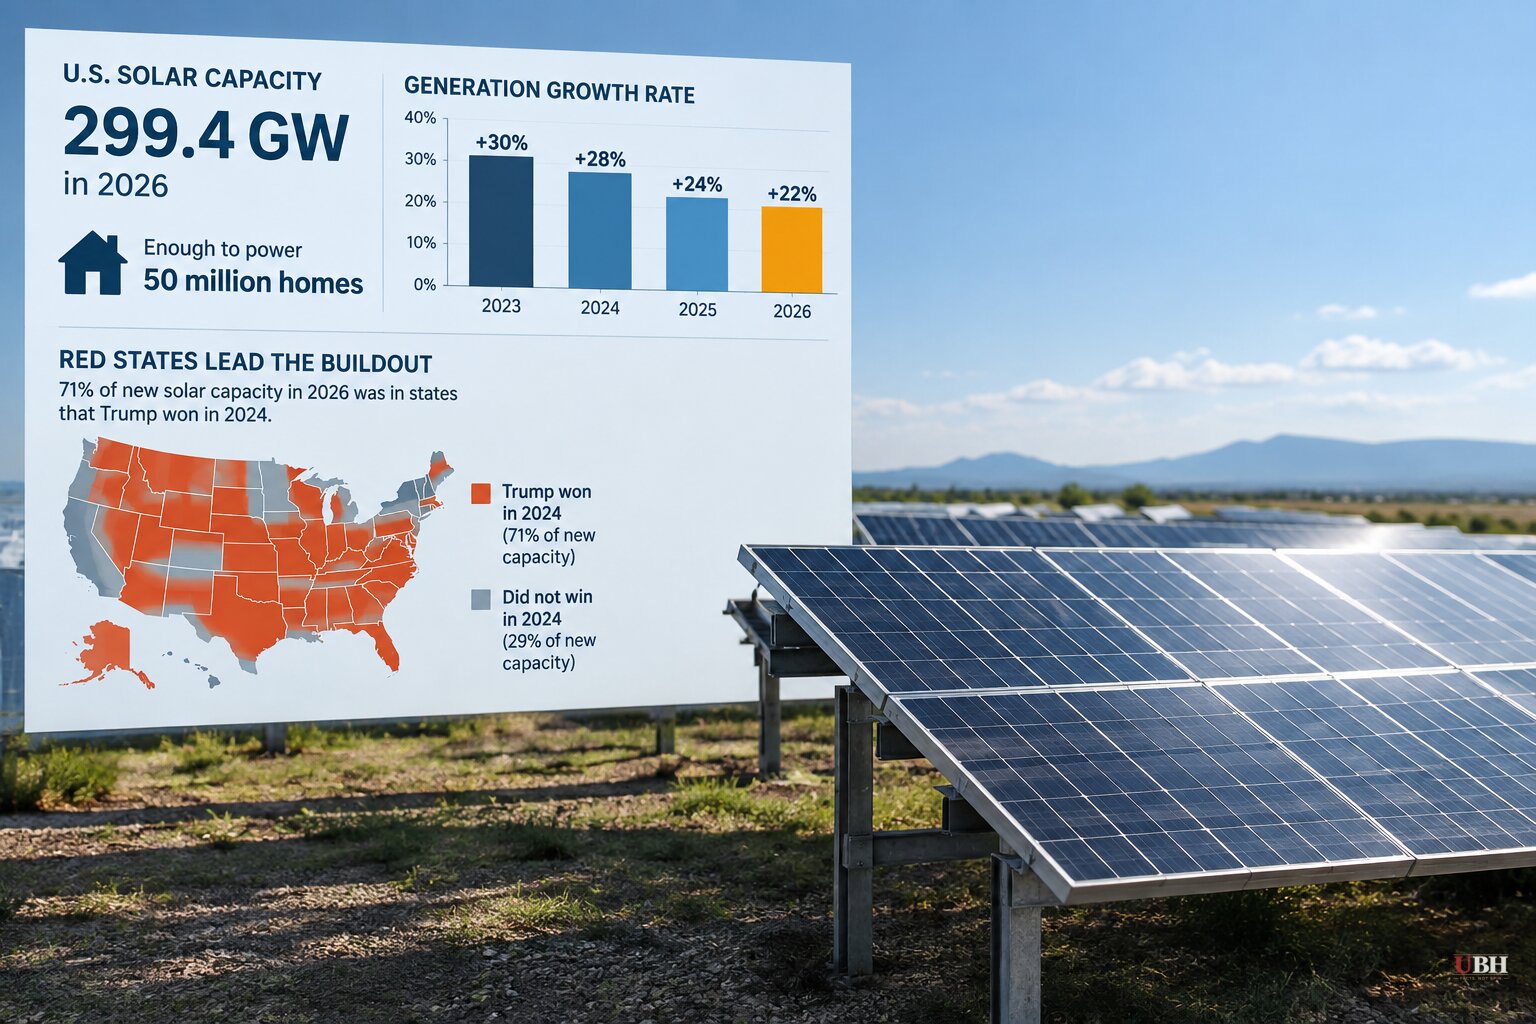
Solar generation grew 39 terawatt-hours in that seven-month window, versus 48 TWh of growth over the same period a year earlier, per Ars Technica. That's still a 22% increase, but a real step down from quarters that regularly topped 30% year-over-year growth. Ars notes some of that slowdown is mathematically inevitable. A bigger installed base means the same absolute gain in output shows up as a smaller percentage.
Ars Technica also points to a specific policy cause: the federal government, under the Trump administration, has been "hostile to renewables" and has removed incentives for their use, which Ars says "may be slowing down solar's previously astonishing expansion." Even so, coal fell more than 10% over the same period, and combined solar generation reached 72% of coal's output nationally, according to Ars's data.
A milestone hit anyway
Despite the slower growth rate, the US crossed a real threshold. Cumulative solar capacity reached 299.4 GWdc across more than 6.2 million installed systems, according to the latest US Solar Market Insight report from the Solar Energy Industries Association (SEIA) and Wood Mackenzie. That's enough to cover the electricity needs of over 50 million households, or roughly a third of the country.
Developers installed 11.4 GWdc of new capacity in the second quarter of 2026 alone, up 45% year-over-year and 43% from the first quarter, per SEIA and Wood Mackenzie. Utility-scale projects drove most of that, up 61% year-over-year. Solar and storage combined made up 70% of all new US generating capacity added in the first half of 2026.
"Solar and storage have grown to a scale most Americans have yet to fully realize, and we simply can't meet America's growing energy needs without these technologies," said Abigail Ross Hopper, SEIA President and CEO.
Why Q2 spiked: a deadline, not a trend
The report ties the Q2 surge directly to developers racing to break ground before the July 2026 safe harbor deadline for federal tax credit eligibility. That's a genuine complication for reading these numbers as a clean upward trend. If developers front-loaded projects to lock in credits before they shrank, the back half of 2026 could look very different once that deadline has passed.
Critics of renewable subsidies have long argued that solar's growth numbers are inflated by a rush to beat expiring incentives rather than reflecting durable underlying demand, and that once the credits are gone, installation rates could drop hard. The coming Q3 and Q4 data will be the real test of it.
But the numbers cut against a simple subsidy-dependency story too. Solar now supplies close to 9% of total US electricity generation, nearly seven times its share a decade ago, per SEIA and Wood Mackenzie, and it kept growing at 22% even as Ars Technica documents an administration actively pulling incentives. The industry employs over 280,000 people across more than 10,000 businesses, with $69.1 billion in private investment in 2025 alone, according to the same report.
Red states, not blue states, are where it's happening
States Donald Trump won in 2024 accounted for 57% of all cumulative US solar capacity and 71% of new capacity added in the first half of 2026, according to SEIA and Wood Mackenzie. Eight of the top ten states for new additions this year were red states, led by fast project execution in sunbelt markets.
Texas holds 55,125 MW of cumulative capacity, trailing only California's 56,457 MW. Florida ranks third at 22,550 MW, followed by Arizona at 13,197 MW and North Carolina at 10,127 MW. This isn't a coastal, blue-state phenomenon. It's cheap land, strong sun, and developers chasing the lowest-cost power, regardless of who's governor.
The manufacturing side is scaling too
Cumulative US solar manufacturing capital spending is on pace to hit $12.2 billion by the end of 2026 since the Inflation Reduction Act passed in 2022, according to Terawatt PV Research data reported by PV Magazine. Annual capex topped $2.5 billion every year since 2023, hitting a record $4.14 billion in 2024, with more than 60% of that coming from First Solar and Qcells, which built new facilities in Alabama, Louisiana, and Georgia.
Operational US module manufacturing capacity has reached 75.3 GW, with another 14.4 GW under construction, while domestic solar cell manufacturing capacity stands at 10.6 GW operational and 19.1 GW under construction, according to SEIA and Wood Mackenzie data cited by PV Magazine. Terawatt PV Research cautions that announced capacity doesn't equal actual output. New factories often run at just 15-20% conversion rates during early ramp-up before reaching 70-80% at mature plants.
A separate story: the Iran war and global clean energy
A different thread, tied to the war the US and Israel launched against Iran in February 2026, shows a mixed global picture that shouldn't be conflated with the domestic US solar numbers above. The Associated Press reported that more than 30 governments have adopted policies to shift away from fossil fuels or improve efficiency since the war began, but global greenhouse gas emissions still rose slightly and overall clean energy investment fell compared to the same period last year, driven mostly by a decline in China, according to Rhodium Group's Clean Investment Monitor.
Hannah Pitt, a director at Rhodium Group, said solar investment specifically grew in the US, Europe, and India, where economies are more exposed to oil and gas price swings. Stanford climate scientist Rob Jackson said in February it was "just wishful thinking" that the war would drive a lasting shift toward renewables unless the conflict proved sustained, and told the AP that durable climate progress requires action "over years, to decades." Pauline Heinrichs, a war studies lecturer at King's College London, described governments as caught "doing a dance between acknowledging the importance of clean power while continuing to support fossil fuel expansion."
What's unresolved
The open question is whether the Q2 2026 installation surge was a genuine acceleration or a one-time rush to beat the safe harbor deadline. SEIA and Wood Mackenzie's Q3 2026 data, once fully released, will show whether utility-scale additions keep climbing or drop off now that the tax credit window has closed, and whether Ars Technica's slower 22% generation growth rate becomes the new normal or falls further.
Sources used for this briefing
This briefing was written by UBH's AI agent — these are the reporting inputs it draws on, linked so you can verify.


