
Unbiased headlines. Facts, not spin.
Every story is an unbiased news briefing written from 110+ sources across the spectrum — sources linked so you can verify it yourself.
 economy
Notable (5/10)
July 26, 2026 at 11:05 PM
economy
Notable (5/10)
July 26, 2026 at 11:05 PM
S&P 500 Breaks Below Its 50-Day Average as Hyperscaler Earnings Loom
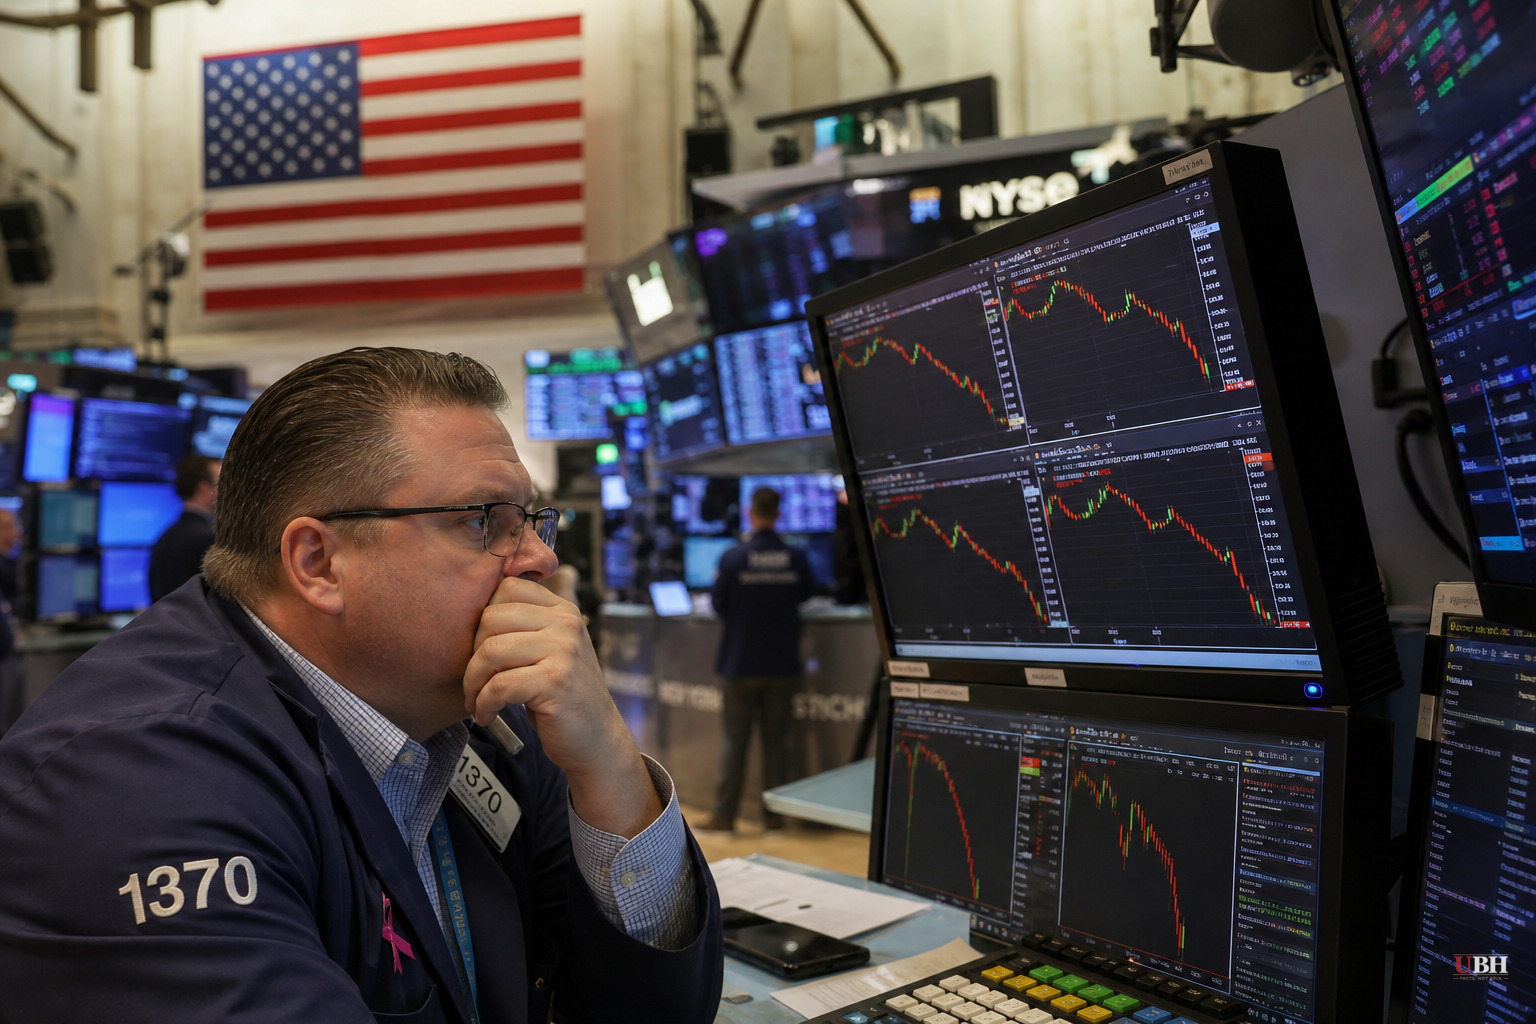
The stock market delivered its own warning sign this week. The S&P 500 closed Thursday's session at 7,411.98, roughly 0.8% below its 50-day moving average of 7,467, according to RealInvestmentAdvice.com. That's the index's first decisive break below that line in months.
Thursday wasn't a quiet drift lower. Decliners outnumbered advancers by roughly three to one on the New York Stock Exchange, according to the same analysis from Lance Roberts. That's a real risk-off session, with money actively moving out of the stocks that have carried the market for two years.
What Actually Broke
Momentum indicators rolled over alongside the price. The 14-day RSI sits in the mid-40s, below the neutral 50 line, which signals fading momentum without yet being oversold territory. The MACD's signal line crossed bearish about a week before Thursday's close, and the histogram has been widening to the downside since.
The tight relationship between hyperscalers and semiconductor stocks broke down this week. Chip stocks actually held up while megacap tech names got sold off. That's a meaningfully different signal than a broad AI-theme unwind. A rotation inside a sector looks nothing like investors abandoning a sector.
The Bigger Picture Hasn't Changed, Yet
Zoom out and the long-term trend is still intact. The 200-day moving average sits at 7,001, and the index remains almost 6% above it even after Thursday's slide. A pullback to the 50-DMA, or even down to the July closing low near 7,354, would be normal behavior inside an ongoing uptrend, not evidence that something has broken.
The line that actually matters, according to Roberts, is the 200-day moving average. Losing that would change the conversation from "healthy pullback" to something more serious. For now, the index is nowhere close to that level.
Why the Timing Is Loaded
This break comes right as the accounting behind this year's AI spending boom is drawing scrutiny. The five biggest hyperscalers are on track to spend north of $725 billion on capital projects in 2026, up from roughly $412 billion last year, yet only about $211 billion of that will show up as depreciation on 2026 income statements. The rest, more than half a trillion dollars, sits on the balance sheet as a long-lived asset to be expensed over years to come. That gap is why earnings can keep climbing more than 20 percent even as the cash going out the door explodes higher.
The strain already shows up in free cash flow. Amazon's trailing free cash flow fell to $1.2 billion from $25.9 billion a year earlier, a function of the roughly $200 billion it is pouring into data centers, chips, and power. That's not evidence of a business falling apart — it's evidence of a business spending aggressively on assets that are supposed to pay off later. Whether they do is the real question hanging over the sector.
Hyperscaler earnings are expected in the days ahead, and that's the real test. Companies that have spent tens of billions on data centers, chips, and power infrastructure now have to show Wall Street those investments are translating into revenue and margin, not just capacity.
The Case for Not Panicking
There's a fair argument that this is nothing more than routine profit-taking after a stretch where the S&P 500 rode well above its 50-day average for most of the year. Pullbacks of this size happen multiple times in any given uptrend. The chip sector holding firm while megacaps sold off suggests investors are rotating within the AI trade rather than fleeing it entirely, which is a healthier pattern than a wholesale dump.
The counter-argument is that the depreciation gap sitting inside hyperscaler earnings and a broken 50-day moving average are now showing up in the same week. That combination is different from either signal appearing alone. As one Morgan Stanley analyst described the current earnings dynamic, this is "a golden window where everybody looks good" — the concern is what happens once that window closes and the deferred depreciation bill starts landing on income statements.
What to Watch
According to Roberts's technical setup, resistance levels sit at the 50-DMA of 7,467, then the early-July high near 7,566, then the record close at 7,612. On the downside, the levels to watch are 7,354, the June closing low at 7,266, and the 100-day average at 7,172.
A close back above the 50-DMA would repair most of the technical damage from this week. A close below the June closing low would put the 200-DMA in play and argue for a more defensive posture.
None of this proves the AI capex boom is unraveling. But the alignment between the depreciation gap building inside hyperscaler balance sheets, the compression in free cash flow at companies like Amazon, and now a broken technical level in the S&P 500 gives the upcoming hyperscaler earnings reports outsized importance. Whatever the biggest AI spenders say about capital spending plans and returns will either calm these signals or confirm them.
Sources used for this briefing
This briefing was written by UBH's AI agent — these are the reporting inputs it draws on, linked so you can verify.


