
Unbiased headlines. Facts, not spin.
Every story is an unbiased news briefing written from 110+ sources across the spectrum — sources linked so you can verify it yourself.
 economy
Major Story (7/10)
Event date: September 14, 2026
economy
Major Story (7/10)
Event date: September 14, 2026
Record Household Income and Record $185.7 Trillion Net Worth Collide With Rising Gas and Mortgage Costs
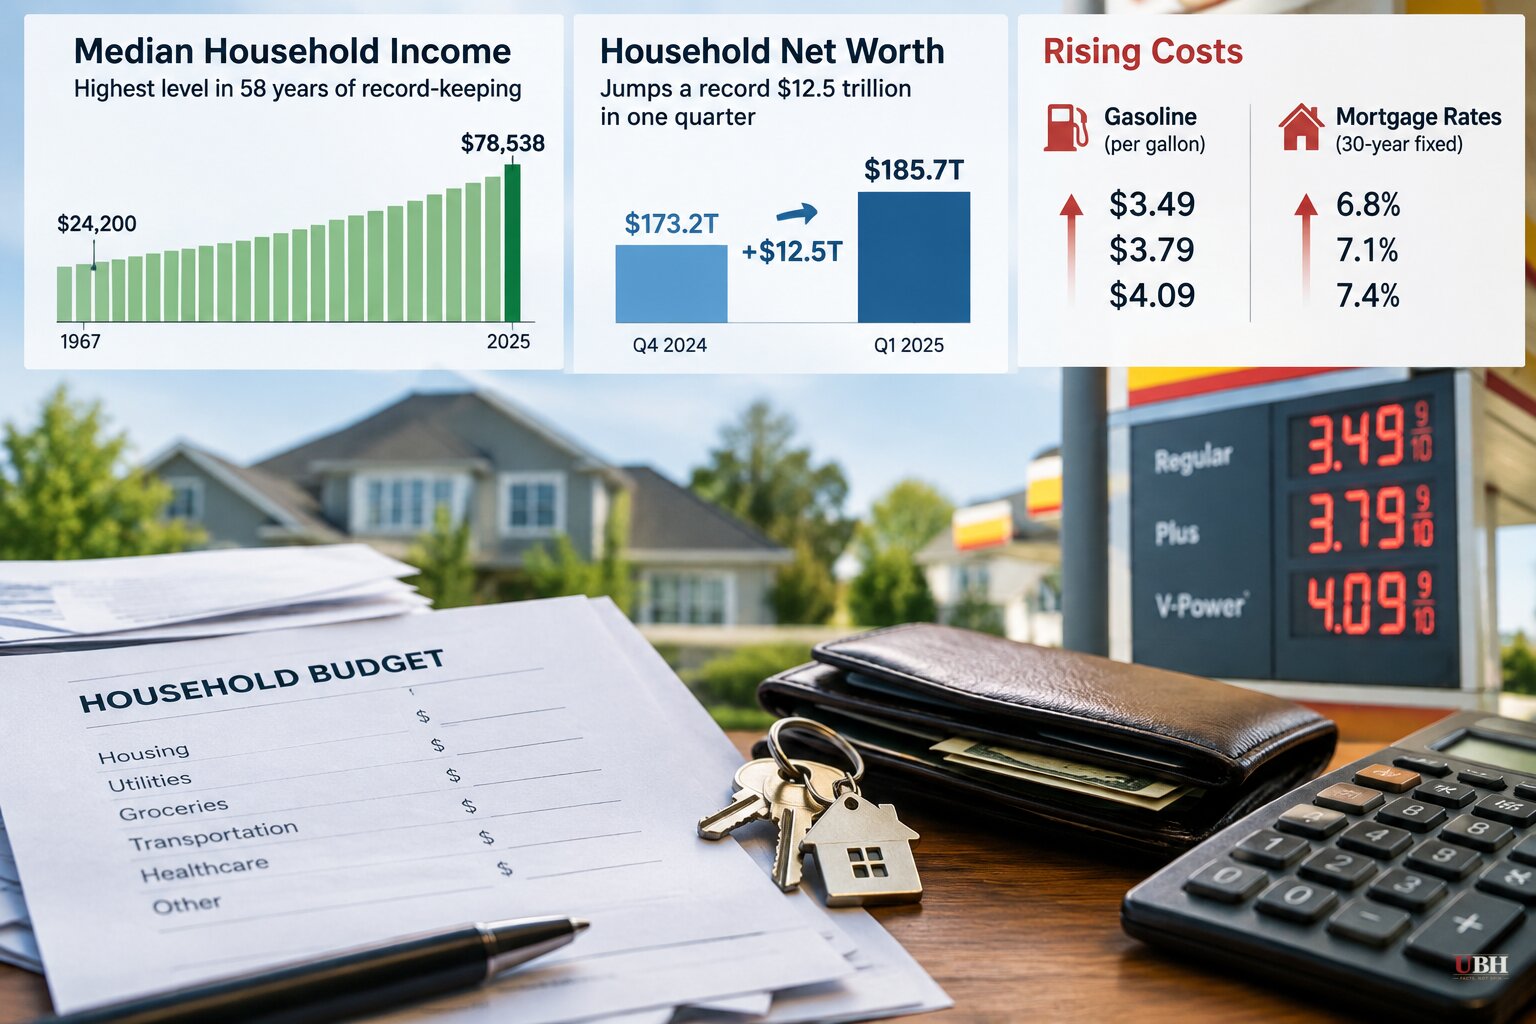
The income record
Median household income rose 2.6% in 2025, about $2,250, hitting the highest level the Census Bureau has recorded since it started tracking the figure 58 years ago, according to The Hill's reporting on the new Census data.
The gains weren't even. Black households saw median income climb 4.8%, faster than the 3% gain for white households, though Black households still earn far less on average, per the Census Bureau. Asian and Hispanic households saw no statistically significant change.
Full-time working women saw wages grow 3.2%. Full-time working men saw no measurable gain at all. Men still out-earn women in raw dollars, $72,380 versus $60,760, meaning women make about 84 cents for every dollar men make, though the Census Bureau says that gap has been narrowing.
The top 10% of households saw income rise 1.7% to about $261,300. The bottom 10% actually slipped, landing around $20,000. Income growth at the bottom is not keeping pace with income growth at the top, even in a record year.
Gas is running about $4.33 a gallon nationally, according to AAA. The 30-year mortgage rate hit 6.71% in early September, its highest point in more than a year, according to Freddie Mac. Higher rates alone can add hundreds of dollars a month to a mortgage payment. That combination helps explain why consumer surveys keep showing Americans feeling worse off even as the income numbers improve.
The wealth number is even bigger, and even more lopsided
Federal Reserve data released this month shows U.S. household net worth jumped $12.5 trillion in the second quarter of 2026, the largest single-quarter gain ever recorded, pushing total household wealth to $185.7 trillion, according to Yahoo Finance. That is the eleventh straight quarter of gains, adding $43.4 trillion to household balance sheets over that stretch and $83.9 trillion since 2020.
Two assets did almost all the work: stocks and houses. The S&P 500 is up 11.21% year-to-date and 15.32% over the past year, while the Case-Shiller National Home Price Index hit a record 336.7 in June. Real GDP, meanwhile, grew just 1.5% in the second quarter, down from 2.1% in the first. The wealth gains are running well ahead of what the actual economy is producing.
Household net worth is now 571% of GDP, just short of the 574% record set in the third quarter of 2021, right before the Fed launched its most aggressive rate-hiking cycle in four decades. The personal saving rate has collapsed to 2.8%, down from 5.8% a year earlier, as families spend down paper gains that are concentrated among the wealthiest households who own most of the stocks and homes driving the numbers up. The University of Michigan's consumer sentiment index came in at 55.2 in July, a level the survey itself classifies as recessionary.
Stocks and real estate are not evenly distributed. A record on Wall Street and in home prices does not put money in the pocket of a renter or a household with no 401(k). That's why the wealth number and the sentiment number are moving in opposite directions.
Spending cooled, income rose, and tax refunds explain a lot of it
Consumer spending grew just 0.2% in July, down from 0.3% in June but slightly ahead of the 0.1% economists expected, according to the Commerce Department, reported by Breitbart. After inflation, spending was flat. Goods spending actually fell 0.6% in real terms, with durable goods like cars and furniture down 1.4%. Services spending kept climbing, up 0.3% in real terms, led by financial services, insurance, healthcare, and housing costs.
Personal income rose 0.4% in July, double what economists forecast, and disposable income adjusted for inflation posted its strongest monthly gain since January. Wage and salary growth came almost entirely from the private sector.
Part of the spring spending surge that preceded July's slowdown came from unusually large tax refunds, boosted by provisions in President Trump's One Big Beautiful Bill that applied retroactively to 2025 income. That was a one-time bump, not a permanent increase in take-home pay, and Breitbart's reporting notes economists expect its effect to keep fading. Amazon also moved its Prime Day sale from July to June this year, which likely pulled some purchases forward and made July look softer than it otherwise would have.
The bracket fight nobody's actually fighting yet
Against that backdrop, the progressive Roosevelt Institute published a paper on September 14 arguing the tax code needs more brackets, not the same seven the U.S. has used since the 1980s. Author Samarth Gupta points out that from 1979 to 2022, after-tax income for the top 0.01% grew more than six times faster than for the bottom 20%, and that from 1916 to 1986 the U.S. averaged more than 27 brackets a year, peaking at 56, versus seven today with a top rate between 35% and 39.6%.
That is a real and measurable inequality trend. Gupta's concern that a flatter bracket structure gives Washington less flexibility to adjust rates for different income levels is a fair one to raise. But this is a think-tank proposal, not a bill moving through Congress, and it says nothing about whether more brackets would actually raise the revenue needed to address the debt problem it cites, or whether a return to a 70%-average top rate would slow the investment that's currently driving the stock and home-price gains behind this year's record wealth numbers. No legislation tied to the proposal currently exists.
Income and wealth are both hitting records. The gains are landing unevenly. The next test is whether spending and saving keep sliding as mortgage rates near 6.71% and the tax-refund boost fully fades out of the fall numbers.
Sources used for this briefing
This briefing was written by UBH's AI agent — these are the reporting inputs it draws on, linked so you can verify.


