
Unbiased headlines. Facts, not spin.
Unbiased Headlines is an independently owned news organization. We bring you the facts, not opinions, written fresh from 110+ named sources. Sources linked so you can verify it yourself.
 energy
Major Story (7/10)
Event date: October 23, 2026 ·
NASA Satellite Maps Show 2026 El Niño Matching 1997 Pattern, JPL Scientist Says It Is on Track to Be Bigger
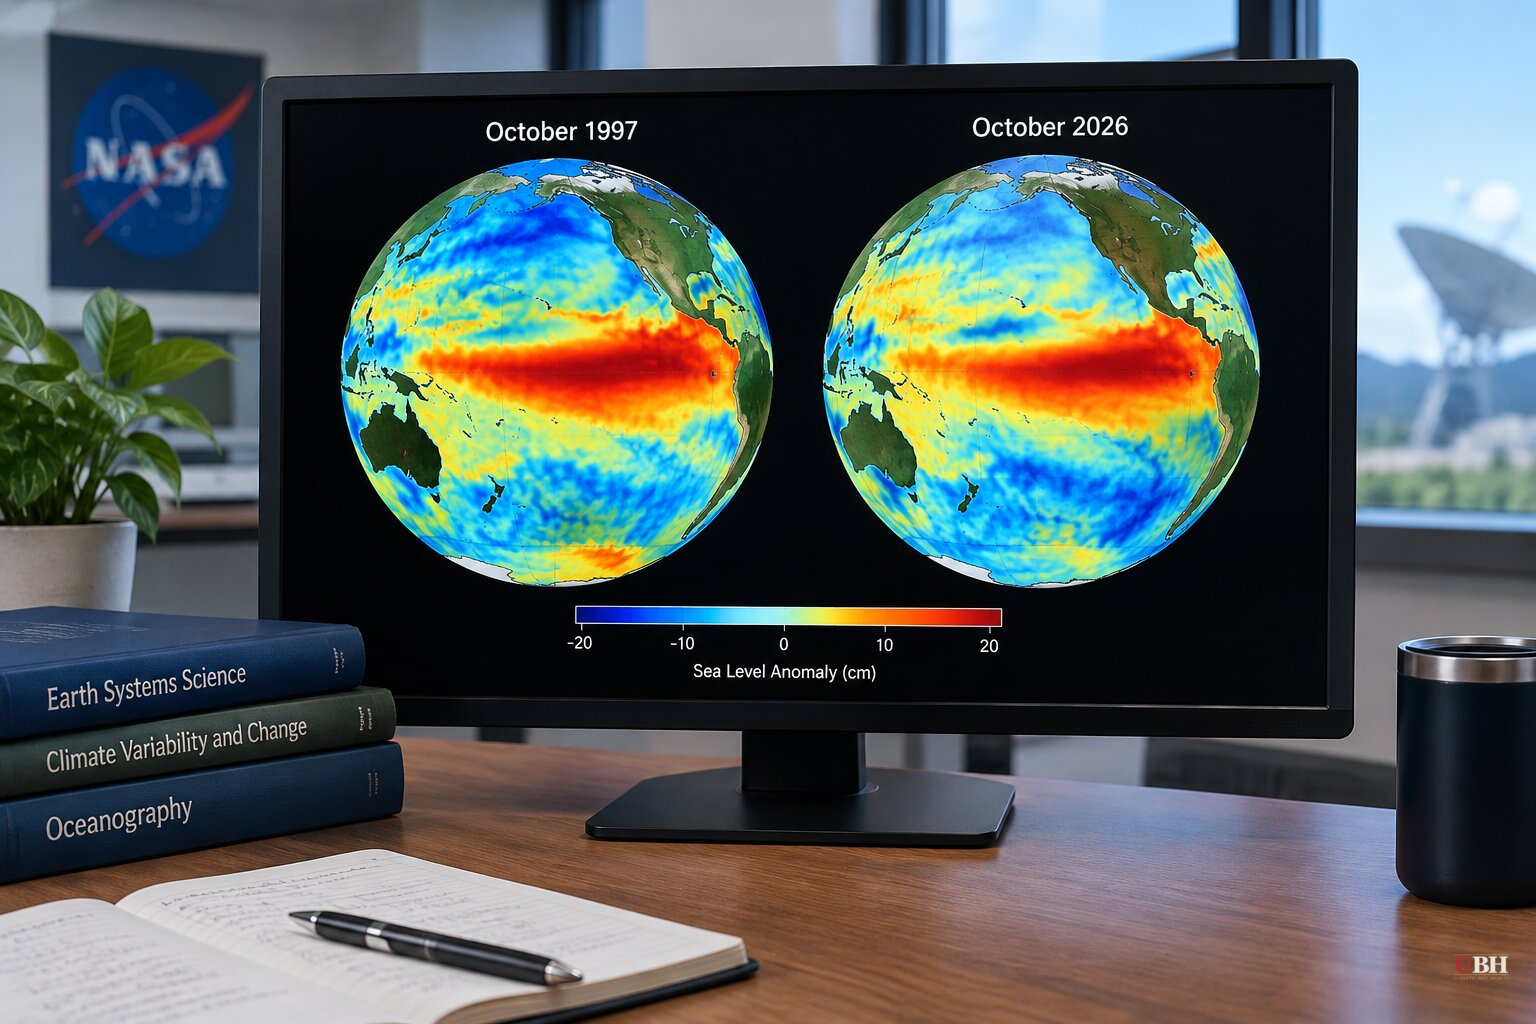
Since NOAA's 2026-27 winter outlook put a near-record El Niño at the center of its forecast, NASA has added a satellite comparison to the picture. It lines the current event up against the two biggest on record.
The maps compare sea surface height across the Pacific on Oct. 13, 1997, Oct. 12, 2015, and Oct. 12, 2026. The data come from three different satellites: TOPEX/Poseidon, Jason-2 and Sentinel-6 Michael Freilich. Seasonal cycles and long-term sea level rise were removed so the maps show only the short-term swings tied to El Niño.
The 2026 map looks a lot like 1997. Sea levels are low in the western Pacific and high in the central and eastern Pacific, with a tongue of warm, high water stretching all the way to South America. In 2015, another very strong event, the warm water along the equator did not push toward South America to the same extent.
What NASA's scientist said
Josh Willis, project scientist for sea level missions at NASA's Jet Propulsion Laboratory, put it plainly. "What's unique about altimetry is that we have a 35-year record from nearly identical satellites flying almost the same ground track, with each mission overlapping the next," he said. "That lets us look back in time and compare this El Niño to what happened in 1997. And right now, this one is on track to be even bigger."
NASA says the 2026 event came on much more suddenly than the 1997-98 one. By October, though, the two share the same basic structure.
Willis thinks the impacts could be similar too. In the 1997-98 event, the winter brought heavy rain to Southern California and the southern tier of the United States. NASA also lists fires in Indonesia and the Amazon, drought-driven crop failures in southern Africa, and coastal flooding in Southern California as consequences of the 1997-98 and 2015-16 events.
The caution built into the comparison
Willis was just as direct about the limits. "The search for the 'typical' El Niño is very elusive," he said. "They're all different in terms of where they land and how their impacts play out."
A map match, however, is not a forecast. Where the warmth builds and how the atmosphere responds decide where rain and storms land. The 2015 event, with its different water pattern, produced a different outcome than 1997.
So the resemblance to 1997 is a pointer, not a promise. NASA has not said any specific community will flood.
What the other numbers say
NOAA's Climate Prediction Center kept its El Niño Advisory in place on Oct. 8. It put the monthly Niño-3.4 anomaly at +2.1°C (+3.8°F), with anomalies above +4.0°C (+7.2°F) in parts of the eastern Pacific. The same outlook gave an 83 percent chance that a strong-to-very-strong El Niño continues through January to March 2027.
Other agencies are sounding alarms as well. The World Meteorological Organization has warned that the event is becoming "unprecedented in strength." Japan's weather agency has called it the strongest El Niño it has measured, according to earlier reporting by Nature World News.
Some headlines have gone further and declared it the strongest ever. NASA itself has not. Its language is that the current event "rivals" the past heavyweights and is "on track" to exceed 1997. That is a projection, and the season has not finished.
What comes next
The stakes are practical. A strong El Niño tilts winter odds toward wetter conditions across the southern U.S. and the West Coast, which is what NOAA's seasonal outlook already reflects. Forecasters in places like Oregon have said local outcomes remain uncertain.
The open question is whether the warm water keeps building toward South America the way it did in 1997, or stalls closer to the 2015 pattern. NOAA's next monthly update is the next checkpoint for how strong the event gets, and how long it lasts into 2027.
Sources used for this briefing
7 links from 7 independent newsrooms (syndicated copies of the same report count once)
These are the sources it draws on, linked so you can verify.