
Unbiased headlines. Facts, not spin.
Unbiased Headlines is an independently owned news organization. We bring you the facts, not opinions, written fresh from 110+ named sources. Sources linked so you can verify it yourself.
 economy
Major Story (7/10)
Existing Home Sales Fall to 3.75 Million Pace in October, Slowest Since 2010, as Mortgage Rates Stay Above 7%
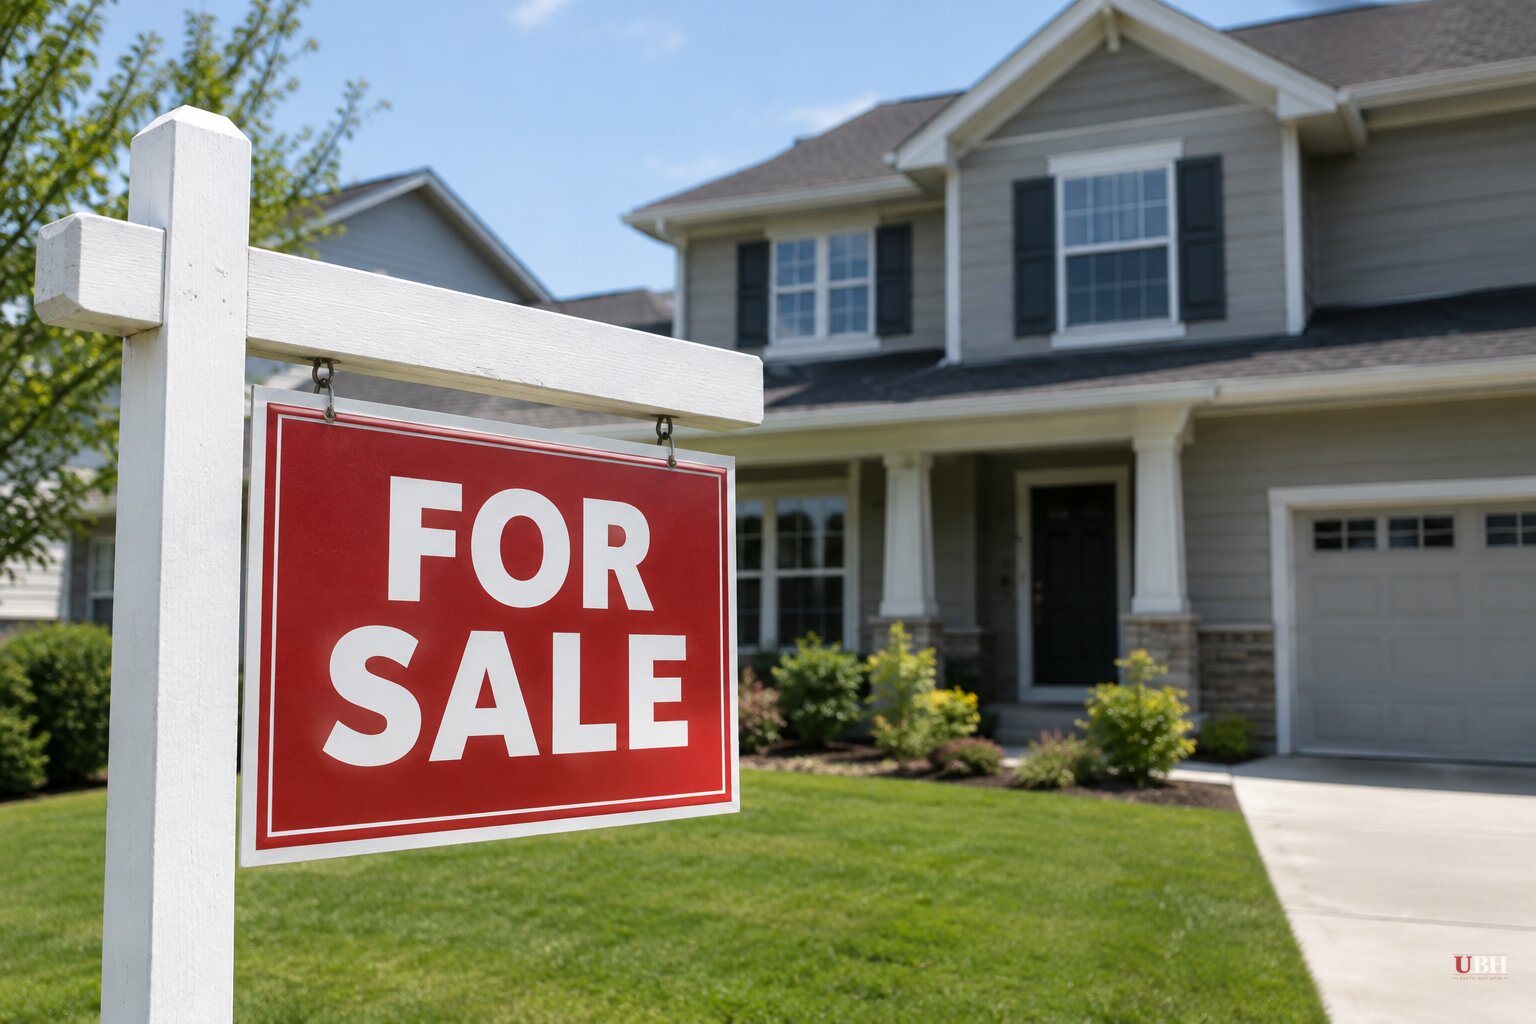
Americans bought previously owned homes in October at the slowest pace in more than 16 years.
Existing home sales fell 5.5% from September to a seasonally adjusted annual rate of 3.75 million, the National Association of Realtors said Thursday, Nov. 12. That is the lowest since August 2010, when the market was still recovering from the housing crash. Sales were down 8.8% from October 2025 and missed the 3.8 million pace economists surveyed by FactSet had expected.
"It is just a tough market for buyers and sellers," said Lawrence Yun, NAR's chief economist.
Sales down, prices still up
October was the third straight month below a 4 million pace. Sales have mostly hovered near 4 million since 2023. The historic norm is closer to 5.2 million.
Prices did not follow volume down. The median sale price rose 0.4% from a year earlier to $416,700, the highest ever recorded for an October in NAR data going back to 1999. Prices have now risen year over year for 40 straight months.
Inventory is improving for the few who can act. There were 1.59 million unsold homes at the end of October, though that is still below historical norms. Properties are sitting longer, and buyers have more choice and more room to negotiate.
The rate problem
The 30-year mortgage averaged above 7% in September and reached about 7.4% in early October, its highest in nearly three years, according to the AP-style rate tallies carried in the NAR coverage. Rates briefly dipped below 6% before the U.S.-Iran war began in late February.
The link runs through inflation. Oil prices surged after the war started, inflation expectations rose, and long-term bond yields, which lenders use to price home loans, went up with them. Different trackers put the current rate between roughly 7.2% and 7.4%. Zillow-based data compiled by NerdWallet showed 7.26% for the week ending Oct. 22.
Many October closings were contracts signed in August and September, when Freddie Mac's average ran from 6.65% to 7.03%. The next wave looks weaker. NAR's pending home sales index fell 7.3% in September from August and 11.3% from a year earlier, with all four regions of the country declining.
Is 7% actually the problem?
Not by itself. The average 30-year rate has been about 7.7% since Freddie Mac began tracking in 1971, and it sat near 7.18% in November 1997, almost where it is now.
The difference is the price tag. Since 1997 the median existing single-family home price has risen 228%, while median household income has risen 136%, according to CNBC calculations from NAR and Census Bureau figures. On a 20% down payment at 7.18%, principal and interest on a median home comes to about $2,291 a month. A buyer spending the same share of income as in 1997 would pay roughly $1,650, a gap of about $640 a month before taxes, insurance or maintenance.
"A 7% mortgage rate isn't historically outrageous, but a 7% mortgage on today's home prices is a completely different animal," said Corinna Rose, a certified financial planner at Bell Investment Advisors.
Hannah Jones, a senior economic research analyst at Realtor.com, said home price growth has "well exceeded wage growth over the last 10, 15 years." She and others also point to pandemic-era rates, which boosted purchasing power and fed bidding wars. When rates rose, prices did not fall enough to offset them.
A generational squeeze
A Redfin report released Thursday, Nov. 12, compares generations. Elder millennials who bought around age 30 spent about 27% of income on housing, versus 36% for boomers at the same age, helped by sub-3% rates and higher incomes. Since rates rose above 6% in 2022, Redfin says elder millennials have spent up to 35% of income on mortgage payments, compared with roughly 25% for boomers.
Boomers have a rebuttal, and Redfin acknowledges it. Rates peaked above 16% in 1981 and stayed in double digits for much of that decade. But typical home prices were lower then, about $235,000 to $265,000 in today's dollars, against $275,000 to $455,000 for millennials in their prime buying years. Redfin adds that boomers could refinance repeatedly as rates fell through the 1980s, 1990s and early 2000s.
The human cost shows up in surveys. A FICO survey found 62% of non-owners say homeownership feels out of reach. The New York Fed's Survey of Consumer Expectations found the average probability of buying and moving within three years at 52.9%, the lowest since 2014, and that was before the latest rate climb.
Rey Sosa, a 32-year-old city planner in Seattle, told The Daily Upside that homes in his budget would mean an hour-plus commute and more than 40% of his take-home pay on the mortgage, well above the 30% advisers recommend. "Maybe it's just better to stay out of the market," he said.
What comes next
NerdWallet says major forecasters are uniformly predicting the 30-year rate will stay around current levels into next year. Redfin says rates could eventually fall far enough for millennials to refinance, but it offers no timeline. Until rates fall or prices come down, sales are likely to stay near the 4 million range they have occupied for most of three years.
Sources used for this briefing
5 links from 5 independent newsrooms (syndicated copies of the same report count once)
These are the sources it draws on, linked so you can verify.