
Unbiased headlines. Facts, not spin.
Every story is an unbiased news briefing written from 110+ sources across the spectrum — sources linked so you can verify it yourself.
 economy
Notable (6/10)
June 20, 2026 at 04:04 PM
economy
Notable (6/10)
June 20, 2026 at 04:04 PM
Consumer Sentiment Hit Its Worst Reading Since 1952 in May. The Spending Data Tells a Different Story.
The Number That Shocked Everyone
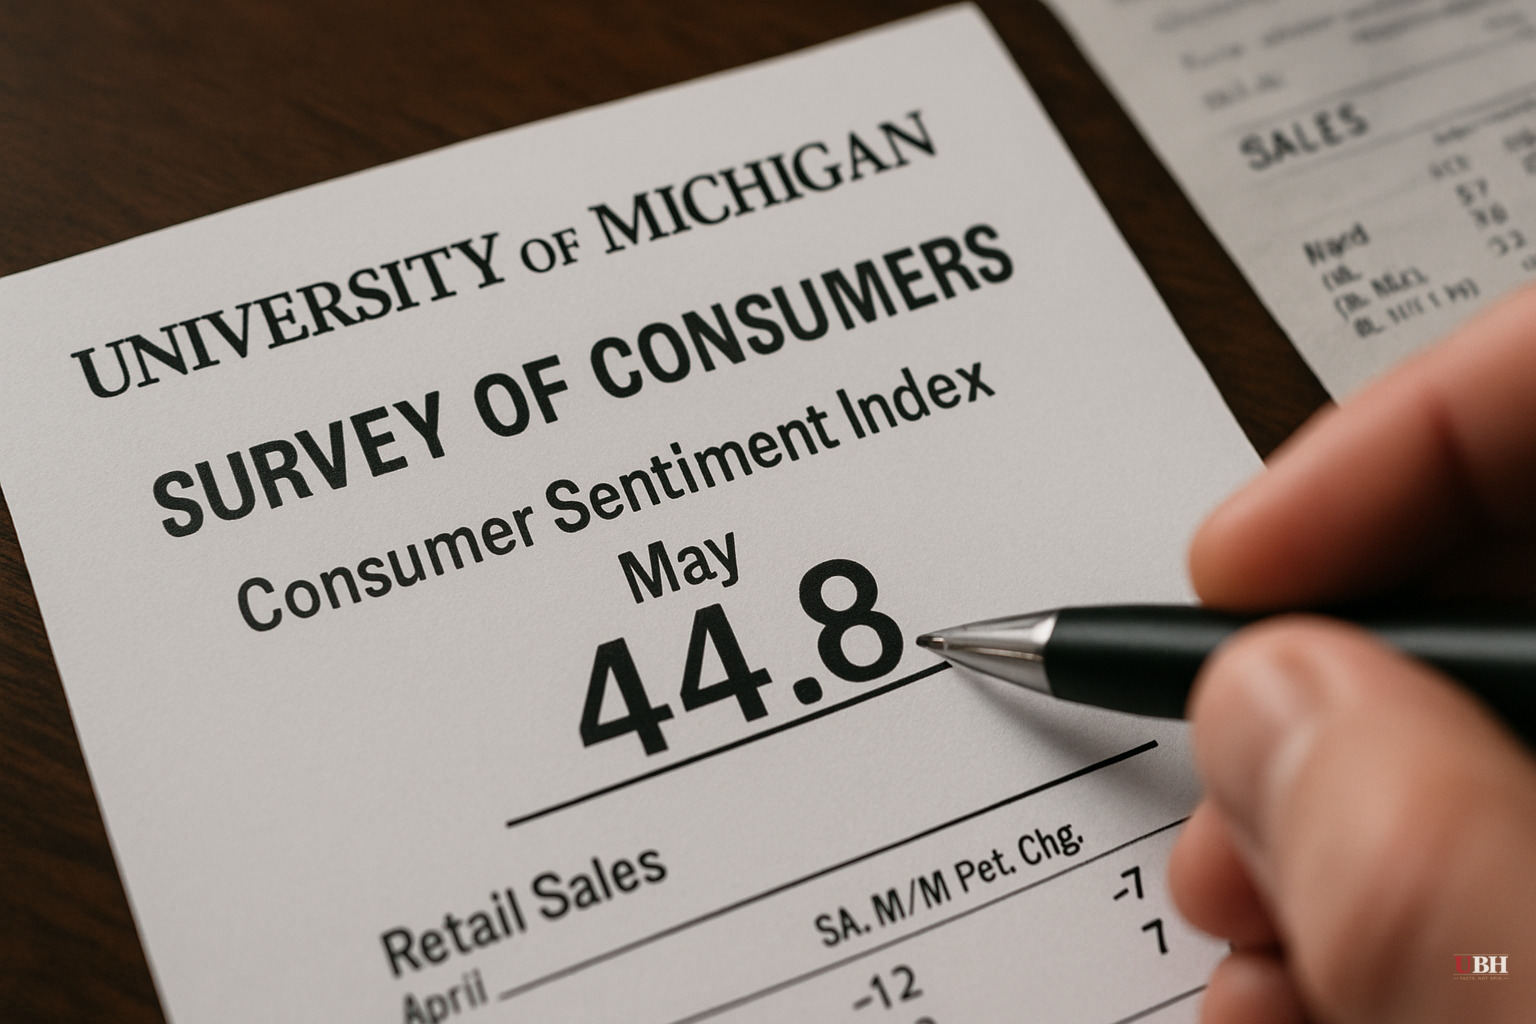
The University of Michigan's Consumer Sentiment Index printed 44.8 in May. According to RealInvestmentAdvice.com analyst Lance Roberts, that is the worst reading since the survey began in 1952 — worse than the 2008 financial crisis, worse than the 1980 inflation panic, and worse than the COVID lockdowns of 2020.
The instinct from many commentators was to declare the hard economic data fraudulent. Philip Pilkington wrote on social media: "GDP is growing at a healthy 2.7% in the US. GDP statistics in the US are clearly completely broken and no longer make any sense whatsoever." That framing circulated widely, but it oversimplifies the picture.
What the Spending Data Actually Shows
Here is what Americans did in April, regardless of what they told pollsters: retail sales rose 0.5% and were running 4.9% above year-ago levels, according to Roberts' analysis citing Commerce Department figures.
S&P 500 companies posted 27% earnings growth in Q1 2026, with an 84% beat rate against analyst estimates — well above the five-year average of 78%. The earnings surprise margin of 20.7% was the strongest since Q1 2021, per the same analysis.
Initial jobless claims came in at 209,000 for the week ending May 16. The unemployment rate sits at 4.3%. The Atlanta Fed's GDPNow model was tracking 4.3% annualized growth for Q2 as of May 21.
None of those numbers describe a country in depression.
Why Both Datasets Can Be Right
The strongest good-faith argument from the pessimist camp deserves serious treatment.
Critics of the hard data point out that aggregate figures can mask serious distributional pain. GDP growth and strong corporate earnings do not automatically mean working-class households feel financially secure. Inflation over the past three years has permanently reduced purchasing power for people who did not own assets that inflated alongside prices. Sentiment surveys capture that lived reality in ways that top-line GDP cannot.
That concern is legitimate and worth taking seriously.
But sentiment surveys have a documented partisan response problem. Research published by the Richmond Federal Reserve in 2024 found that the partisan gap in consumer sentiment is now far larger than the gap by income, age, or education level. The gap between Democratic and Republican sentiment expanded from 21 points under George W. Bush to 25 points under Obama, and then to 45 points under Biden. Researchers have also documented what they call "asymmetric amplification" — Republicans swing their sentiment responses roughly 2.5 times as much as Democrats do, depending on who controls the White House. The Michigan survey is self-reported perception filtered through political identity in ways that spending behavior simply is not.
Roberts notes that in every prior economic cycle over the past 25 years — the 2001 recession, the 2008 financial crisis, the COVID lockdowns — sentiment and actual growth moved in rough alignment. Since 2022, that relationship has broken in a way it never broke before, with GDP running between +2% and +3% year over year for three straight years while consumer sentiment has been running below 70 the entire time — levels that historically only appeared during deep recessions. This divergence itself is significant. It suggests the survey is capturing something real about anxiety and political mood, but may be a poor leading indicator of actual economic contraction right now.
What the Data Is and Is Not Telling Us
Consumer sentiment is not wrong, and GDP figures are not fabricated. They are measuring different things.
The Michigan index is measuring how people feel about their economic situation and prospects. Those feelings are real and they have consequences for political outcomes, for discretionary purchase decisions at the margin, and for business investment confidence. Dismissing a 44.8 print as propaganda or partisan noise ignores genuine financial stress that exists in large portions of the population.
But sentiment surveys are notoriously poor predictors of near-term recession when behavioral data diverges from them this sharply. People say they feel terrible and then go buy things. That is not hypocrisy. It is the difference between anxiety and paralysis.
The GDP skeptics who claim the statistics are "completely broken" have not provided a specific, sourced mechanism by which Commerce Department methodology has changed enough to produce the current growth figures. The labor market, spending, earnings, and credit data all line up in the same direction. When one indicator disagrees with five, the prior should be on the one.
The Open Question
Whether the sentiment collapse eventually drags behavior down with it, or whether behavior stays resilient and sentiment gradually recovers as tariff uncertainty resolves, remains unresolved. Roberts' historical comparison shows this divergence has no precedent in the 25-year history of the data he examined, which means there is no clean template for what comes next.
The Atlanta Fed's GDPNow Q2 estimate of 4.3% growth will face its first major reality check when the advance GDP release arrives. If that number comes in well below the model's forecast, the pessimists will have a much stronger case. If it holds up, the case for a sentiment-driven behavioral collapse will weaken considerably.
Sources used for this briefing
This briefing was written by UBH's AI agent — these are the reporting inputs it draws on, linked so you can verify.


