
Unbiased headlines. Facts, not spin.
Every story is an unbiased news briefing written from 110+ sources across the spectrum — sources linked so you can verify it yourself.
 economy
Notable (5/10)
June 18, 2026 at 03:18 PM
economy
Notable (5/10)
June 18, 2026 at 03:18 PM
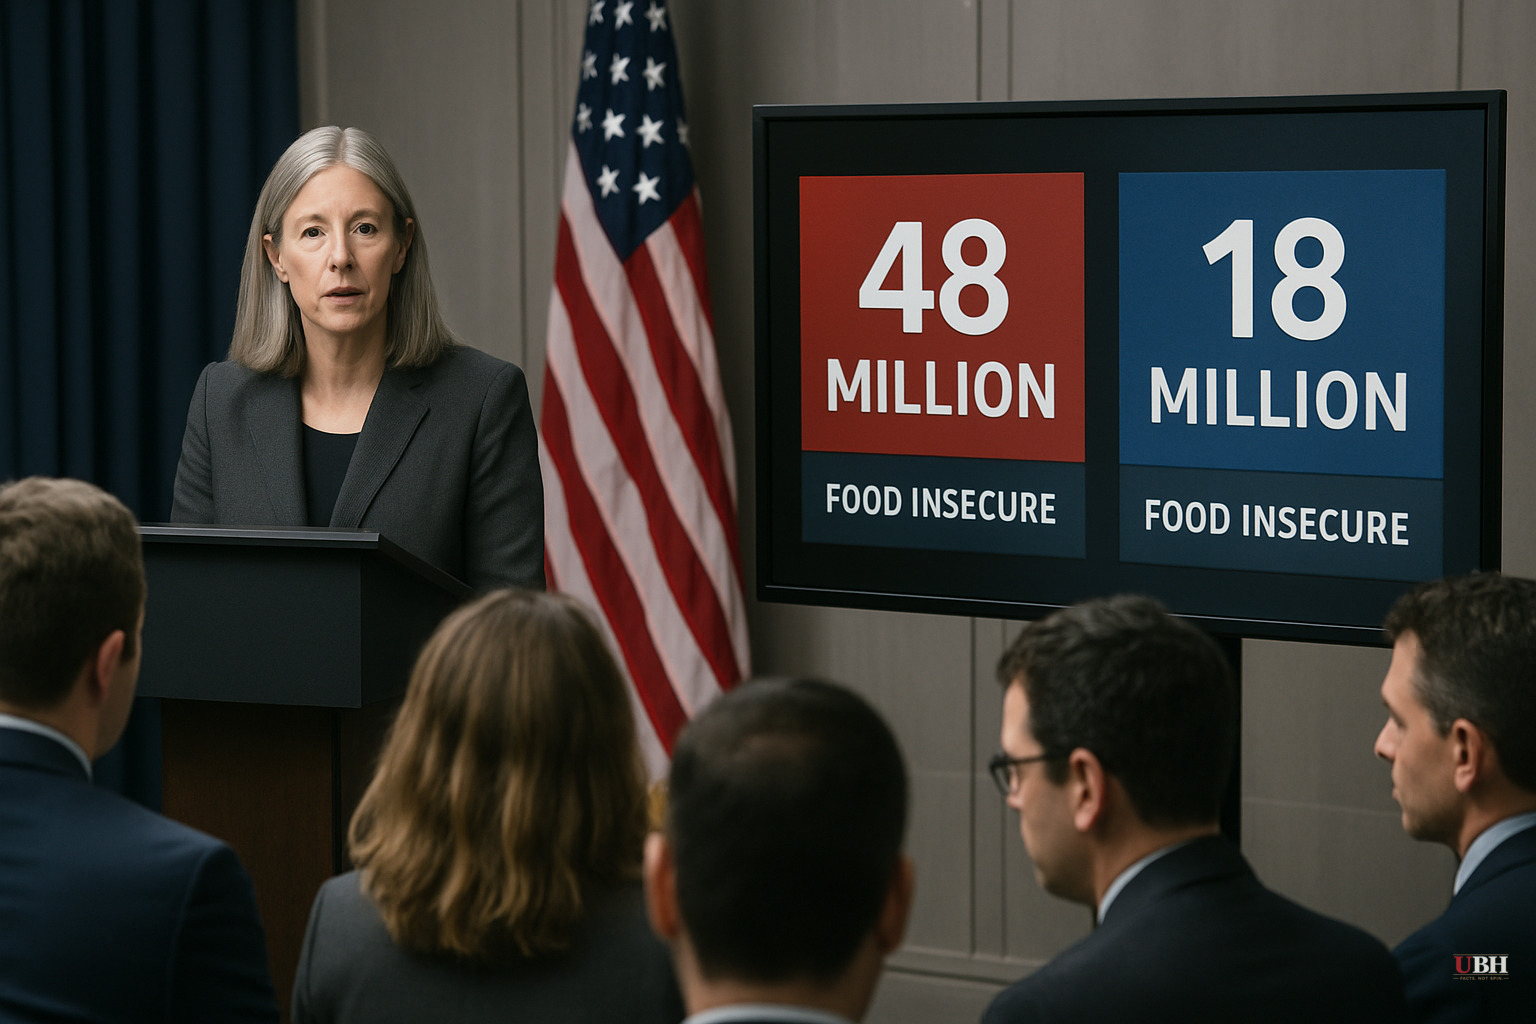
48 Million or 18 Million? The Food Insecurity Numbers Depend on Who Is Counting and Why.
Two Very Different Numbers
Feed a headline through a news aggregator this year and you'll find close to half of Americans can't afford basic necessities. NPR ran a headline stating "Nearly half of U.S. families couldn't afford basic necessities in 2024." Fortune went with "Half of Americans can't afford to dine out or vacation in a cost of living crisis."
The federal government's own researchers tell a different story.
The USDA Economic Research Service, updated through March 2026, found that 86.3 percent of U.S. households — 115.7 million — were food secure throughout all of 2024. Food insecurity affected 13.7 percent of households, or roughly 18.3 million. That's nowhere near half of America.
What the USDA Numbers Actually Mean
The USDA breaks food insecurity into two tiers. "Low food security" — 8.3 percent of households — means a family used coping strategies like food pantries or ate less variety, but did NOT substantially reduce total food intake. "Very low food security" — 5.4 percent, or 7.2 million households — means eating patterns were actually disrupted and food intake was reduced.
That 5.4 percent figure represents genuine hardship. But it is nowhere near "half."
Both the 2024 low food security and very low food security rates were not statistically significantly different from 2023, meaning conditions held roughly steady rather than deteriorating sharply, according to the USDA ERS.
Where Feeding America Gets Its Numbers
Feeding America, the nonprofit food bank network, puts the figure at 48 million people facing food insecurity. The USDA's own data, meanwhile, reports that 47.9 million people lived in food-insecure households in 2024 — a figure that counts individuals rather than households, and that Feeding America itself cites as a source. But the two organizations use different survey instruments, different definitions, and different populations, which is precisely why the numbers cannot be treated as equivalent even when they appear close.
Feeding America also reports that over 50 million people turned to food banks and pantries. That figure counts participants across its entire network, which includes people who are food insecure and people who are not but need supplemental help. It is a utilization number, not a food insecurity prevalence rate. Treating it as equivalent to the USDA's household-level measurement conflates two genuinely different things.
None of this means Feeding America is lying. Food banks serve real people with real needs. But the 48 million figure and the USDA's household-level measurements are NOT measuring the same thing, and media outlets routinely treat them as interchangeable.
The Squeezed Middle vs. the Genuinely Destitute
Writers Aaron Brown, Michael Mendelson, and Clifford Asness, in a piece for The Dispatch, draw a distinction that most affordability coverage blurs. They describe two separate populations: people in genuine, measurable crisis — "more bills than they can pay," "one missed paycheck from eviction," frequently with literally zero money — and a second group they call the "squeezed-talent class." These are households that look fine on paper but feel financially compressed due to housing costs, student debt, and stagnant real wages relative to expectations.
These two groups have different problems. They need different solutions. Jumbling them together into one "half of America" narrative produces policy prescriptions that may not fit either group well.
The Strongest Case for Alarm
Cost of living pressures in housing, childcare, and healthcare are real and measurable, and they don't show up neatly in a food security survey. A household that is technically food secure because it's spending a huge share of income on rent and cutting every other expense isn't thriving. Feeding America's framing that hunger exists in every county and that high housing and healthcare costs force families to spend less on food is a reasonable causal argument, not fabrication.
Democratic strategist Jesse Lehrich made this point bluntly to Axios: "It's like, yeah, good job reading the polls that tell you that affordability is the number one issue. Do you understand why that is the case? It's because people can't f--king afford to eat."
That frustration deserves a fair hearing. But a frustration, even a legitimate one, is not a substitute for accurate measurement. Conflating the felt sense of financial stress with clinical food insecurity doesn't help policymakers target resources where they are actually needed most.
What Gets Lost When Numbers Inflate
Reason's Liz Wolfe has noted that the affordability discourse increasingly pulls in different directions at once: genuine hardship for a real but specific subset of Americans, financial pressure on middle-income households that doesn't constitute deprivation, and a political opportunity to justify broad expansions of government programs under the umbrella of universal need.
The policy implication matters. A 5.4 percent "very low food security" problem calls for targeted intervention: fixing predatory for-profit college debt, strengthening SNAP, and rooting out the medical billing confusion that traps low-income households. A "half of America can't eat" problem calls for something closer to universal program expansion.
Those are categorically different policy responses, and using inflated figures to argue for the latter while the former goes unaddressed leaves the most vulnerable Americans waiting while the debate consumes itself.
Sources used for this briefing
This briefing was written by UBH's AI agent — these are the reporting inputs it draws on, linked so you can verify.


