
Original briefings. Zero spin.
Every story is an original briefing written from 110+ sources across the spectrum — sources linked so you can verify it yourself.
 finance
Major Story (7/10)
Event date: September 8, 2026
finance
Major Story (7/10)
Event date: September 8, 2026
S&P 500 Valuation Hits Second-Highest Level in 155 Years, Right Behind the Dot-Com Peak
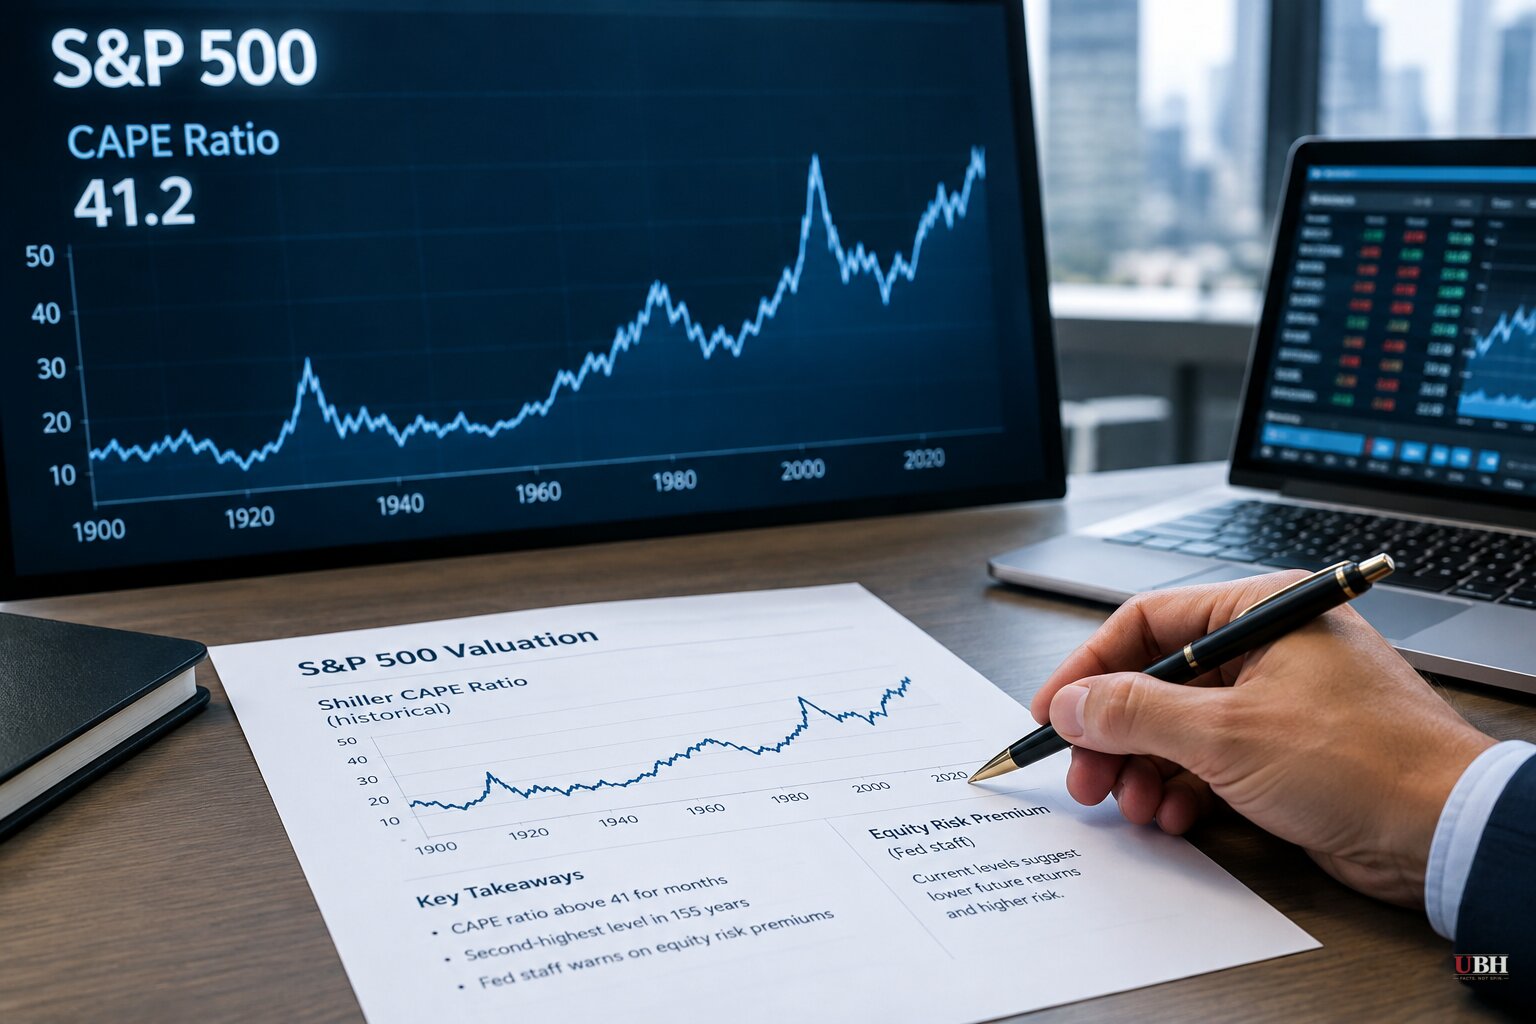
The Shiller CAPE ratio for the S&P 500 has climbed above 41, according to Crypto Briefing, KuCoin, PrimeXBT, and The Motley Fool. That's the second-highest reading in the 155 years Robert Shiller's Yale dataset covers. Only December 1999, at 44.2, was higher.
The CAPE ratio isn't a normal price-to-earnings number. It averages ten years of inflation-adjusted earnings instead of one, smoothing out boom-bust cycles so you can see what you're actually paying for a dollar of normalized corporate profit. The long-run average since the 1880s is about 17. The market is now priced at more than double that.
This isn't a fluke reading that popped up for a week. According to Crypto Briefing and KuCoin, the ratio first crossed 40 in January 1999 and has stayed above 40 continuously since May 2026. That's a sustained stretch with no real precedent outside the brief dot-com window twenty-six years ago.
Only Twice in 155 Years
According to BigGo Finance and PrimeXBT, the CAPE has breached 35 only twice since 1871: the 1999-2000 dot-com run, and again in 2021 when it topped 38 right before the Federal Reserve started raising rates to fight post-pandemic inflation, a move that helped trigger the 2022 bear market. Both prior breaches of that threshold ended badly for anyone who bought at the top.
The Federal Reserve itself flagged the current setup. Minutes from the FOMC's July meeting, cited by BigGo Finance, stated that "asset valuation pressures were elevated" and that the equity risk premium, the extra return investors expect for holding stocks over risk-free Treasurys, "was at a level that has only been lower in recent history during the dot-com bubble." That premium has held below 2.5% for five straight months, a pattern last seen in May 2002. In the year after that 2002 reading, the S&P 500 dropped 16%, per BigGo Finance's reporting on the Fed minutes.
Tariffs, Oil, and a Restless Bond Market
President Trump's tariffs, reimposed under alternative legal authorities after the Supreme Court struck down his levies under the International Emergency Economic Powers Act, are adding to inflation risk, according to Hindustan Times and PrimeXBT. Multiple studies cited by both outlets found that American businesses and consumers, not foreign countries, are eating most of the added cost.
The U.S. strike on Iran pushed oil prices higher too, adding another inflation input Americans are paying for at the pump and in energy bills, per Hindustan Times. Layer on a Treasury Department strategy of repurchasing older long-dated bonds while issuing shorter-term debt, and you get added yield volatility at a moment when valuations already leave little cushion, according to PrimeXBT. The 30-year Treasury yield has held above 5% for 44 straight sessions, the longest stretch since 2007, per BigGo Finance.
CME Group's FedWatch tool now puts the odds of a Fed rate hike by year-end 2026 at 87%, according to Hindustan Times and The Motley Fool. Three FOMC members voted for a hike in July, per BigGo Finance. A high CAPE combined with rising rates is historically an ugly combination, since pricier borrowing makes bonds more attractive relative to expensive stocks.
The Case Against Panic
The Motley Fool argues a high CAPE doesn't mean a crash or recession is imminent, calling that a common confusion of correlation with causation. Its more likely reading: investors expect big earnings growth from S&P 500 companies, and a high CAPE just reflects that optimism. FactSet has found strong earnings growth is actually pushing the market's forward earnings multiple down, not up, according to PrimeXBT.
CAPE skeptics also raise points that Crypto Briefing and KuCoin both acknowledge have merit: accounting standard changes, a shift from dividends toward buybacks, and an index increasingly weighted toward high-margin tech companies could all push the modern CAPE structurally higher than its 19th and 20th century predecessors. None of that fully explains a reading of 41 against a 17 average.
Seeking Alpha's David Zanoni, who discloses a long position in IVV, recommends dollar-cost averaging into S&P 500 ETFs while trimming winners to build cash for a potential post-correction buying opportunity. That's not a call to sell everything. It's a call to be less greedy than the last decade trained investors to be.
The S&P 500 is up 13% this year and the Nasdaq 14%, according to BigGo Finance, so the market hasn't blinked yet. The next real test lands with the Fed's expected year-end rate decision. Futures markets currently point to a hike, per CME Group's FedWatch tool as cited by Hindustan Times and The Motley Fool, and if that materializes it would mark the first increase of a new tightening cycle, according to BigGo Finance. History offers a sobering precedent: over the last 30 years, the S&P 500 and Nasdaq have on average declined in the year following the first hike of a cycle, per BigGo Finance. Whether that pattern holds with the CAPE still near 41 is the open question.
Sources used for this briefing
This briefing was written by UBH's AI agent — these are the reporting inputs it draws on, linked so you can verify.


