
Unbiased headlines. Facts, not spin.
Every story is an unbiased news briefing written from 110+ sources across the spectrum — sources linked so you can verify it yourself.
 finance
Notable (5/10)
July 19, 2026 at 02:41 PM
finance
Notable (5/10)
July 19, 2026 at 02:41 PM
S&P 500 Holds Near Record While Chip Stocks and Momentum Trades Take a Beating
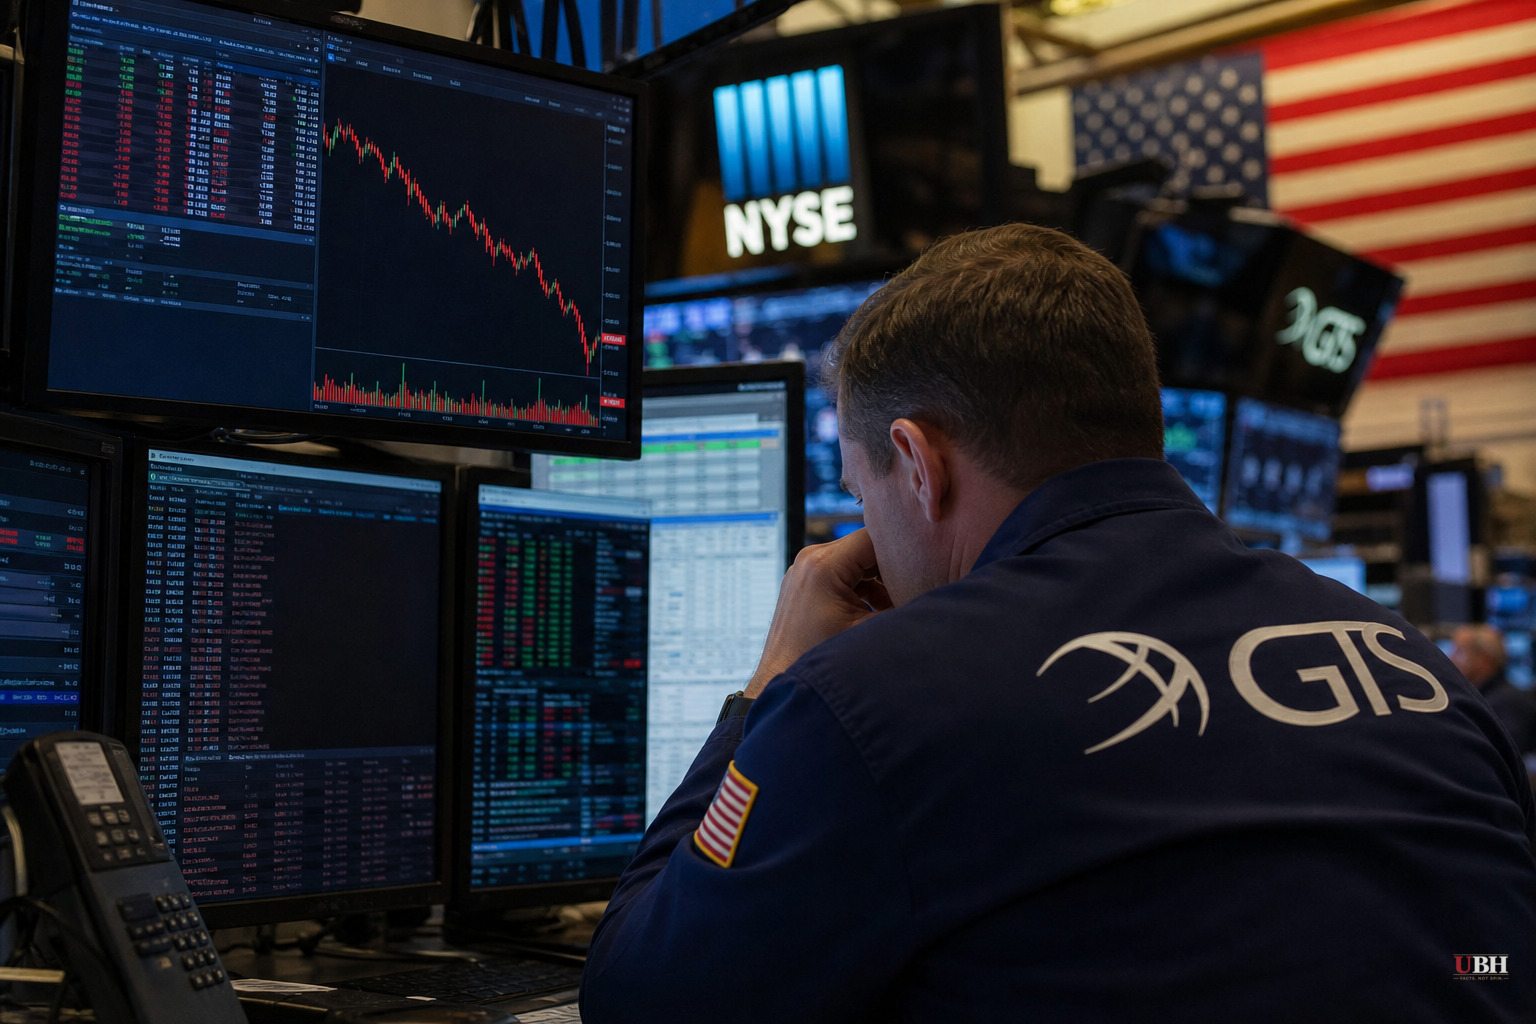
The index looks calm. The trading underneath it does not.
The S&P 500 closed the week ending Friday, July 17, at 7,457.69, according to RealInvestmentAdvice.com analysis published via ZeroHedge. That's almost exactly on top of its 50-day moving average near 7,464. The index is still about 6.8% above its rising 200-day average of roughly 6,985, and sits about 2% below its June 2 record close of 7,620.
By the numbers, this reads like a normal, boring pullback. The S&P fell about 1.5% for the week. The 14-day RSI came in at 48.8, dead center in a neutral range. Nothing screams panic.
But the MACD just crossed below its signal line for the first time since the April low, with the histogram flipping negative, a fresh bearish signal that Lance Roberts of RealInvestmentAdvice.com flagged. He stressed one crossover alone isn't a sell signal.
Momentum funds got crushed. The average stock didn't.
The Momentum ETF, MTUM, fell about 6% on the week, according to the same analysis, with its 14-day RSI dropping to 41, well below the broader market's reading.
Meanwhile the equal-weight S&P 500 lost less than half a percent and touched a fresh record high midweek. The Russell 2000 held up better than the Nasdaq. That's a wide gap between how the cap-weighted index behaved and how the median stock behaved, which tells you the damage was concentrated, not broad-based.
Reuters reported the same underlying story from a different angle: a semiconductor pullback that broadened into a wider selloff by Friday, July 17, dragging Wall Street lower for the day and the week. Reuters also reported that US equity funds saw outflows as chip stocks slid, and separately flagged worries about the durability of the AI rally given how much of it is built on leveraged trades.
The Wall Street Journal's July 17 market wrap put it bluntly: the Nasdaq dropped as the chip selloff deepened. The same day, Intuitive Surgical shares fell as Obamacare-related medtech demand concerns resurfaced, a separate but concurrent pressure point in healthcare-adjacent tech names, per Reuters.
Why the mechanics matter
Finviz's aggregated newsfeed on July 19 flagged a Bloomberg report describing funds getting pulled into a "reverse dispersion trade" amid extreme stock swings, a sign that professional trading desks are actively repositioning around this volatility rather than just riding it out. Reuters separately reported that institutional demand for a $8.6 billion Shanghai IPO from chipmaker CXMT was dented by the broader chip stock selloff, meaning this isn't purely a US phenomenon. It's hitting global semiconductor sentiment.
The Wall Street Journal ran a piece asking whether the S&P 500 is "breaking the earnings playbook." If a market can post modest headline index declines while a specific factor or sector implodes underneath, the traditional read on earnings season, index-level moves as a proxy for the health of corporate America, stops working cleanly.
That's the fair concern from bulls betting the AI trade still has legs: an index near record highs, with breadth actually improving (equal-weight hitting new highs, Russell 2000 outperforming), does not look like a market rolling over. It looks like capital rotating out of the most crowded, most leveraged momentum names and into cheaper, broader exposure. Rotation, not capitulation, is a real and defensible reading of this data.
The counter-concern, and it's a fair one too, is that the MACD crossover and the momentum factor's 6% weekly drop are early warning signs of exactly the kind of narrow-leadership fragility that has preceded past corrections, when a handful of mega-cap tech and AI names carried the index higher and a reversal in those names hits harder than the calm headline number suggests.
What to watch next
Roberts' analysis, via RealInvestmentAdvice.com, names the actual line in the sand: the 50-day moving average near 7,464. A decisive hold keeps the burden of proof on bears. A break on volume opens a test of the mid-July range low near 7,300.
On the calendar, Reuters' "Wall St Week Ahead" coverage flagged Alphabet and Intel earnings as the next major test for the AI trade's underlying strength. Both companies are scheduled to report as part of the current earnings cycle. Until they land, the question of whether this was a healthy rotation or the first crack in a crowded AI trade stays open.
Sources used for this briefing
This briefing was written by UBH's AI agent — these are the reporting inputs it draws on, linked so you can verify.


