
Unbiased headlines. Facts, not spin.
Every story is an unbiased news briefing written from 110+ sources across the spectrum — sources linked so you can verify it yourself.
 finance
Notable (5/10)
May 29, 2026 at 02:28 PM
finance
Notable (5/10)
May 29, 2026 at 02:28 PM
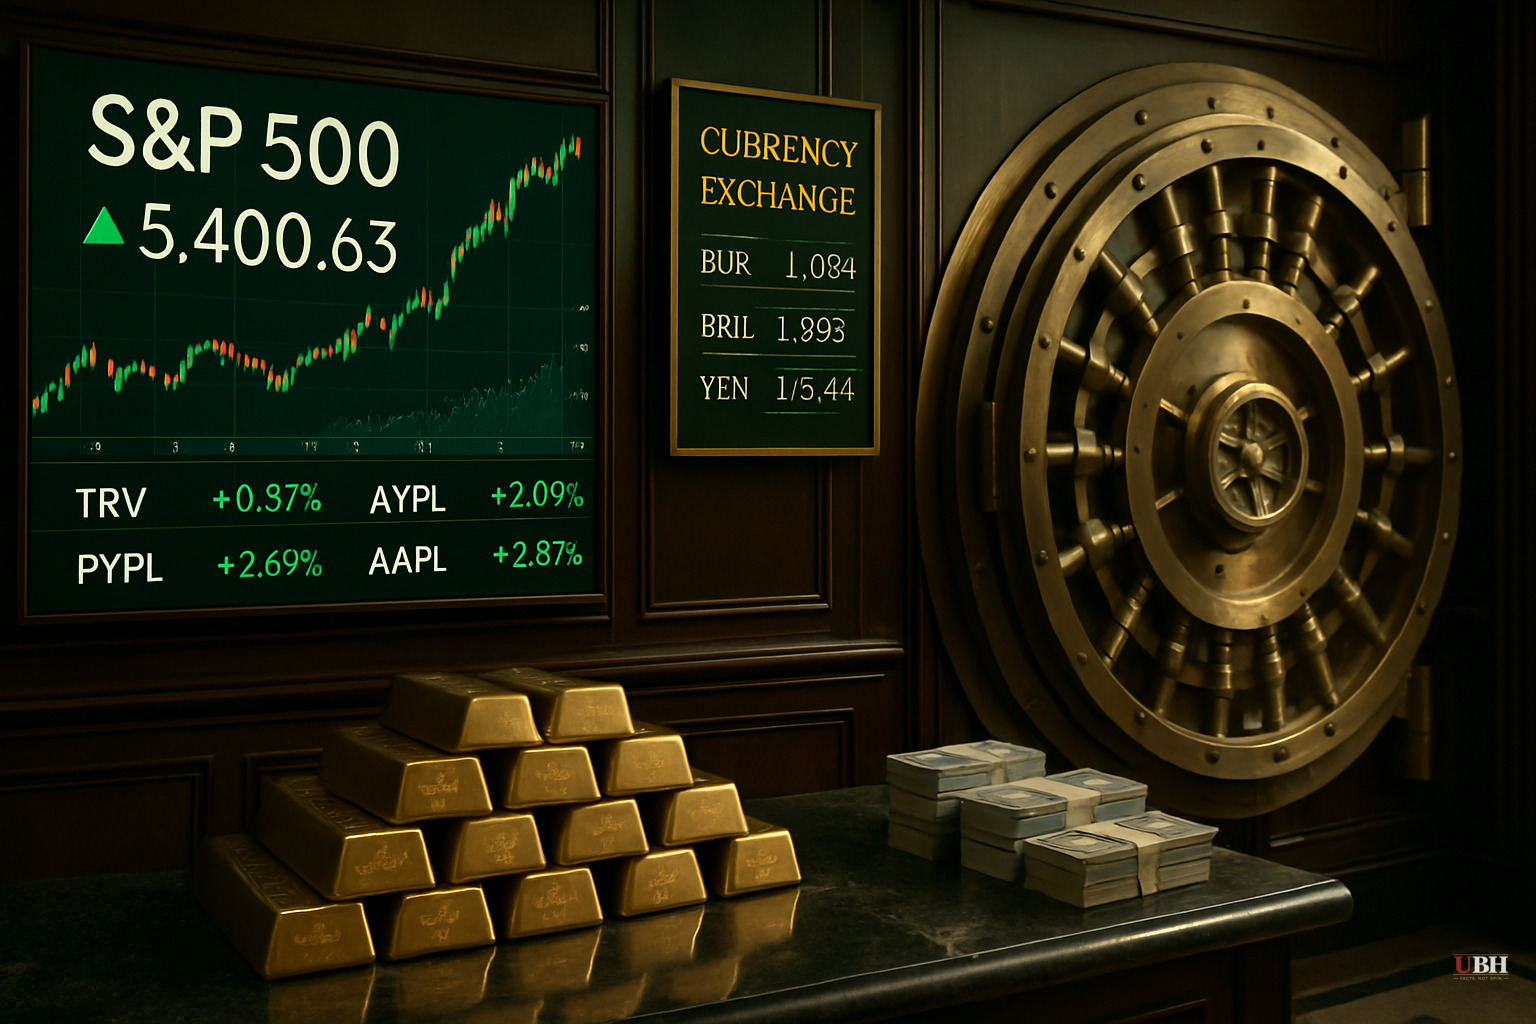
S&P 500 Hits All-Time Highs Eight Weeks Running as $86 Billion in Forced Buying and Iran Deal Drive the Rally — But Smart Money Is Warning the Easy Gains Are Gone
Eight Weeks Up. New Highs. Now What?
The S&P 500 has done something it hasn't done since late 2023 — posted eight consecutive weekly gains. By Friday's close on May 22, the index was sitting at record territory, according to Startup Fortune. The Dow finished at a record closing high. The Nasdaq stayed within striking distance of its own peak.
The index has blown past its January and February highs and invalidated the bear thesis that dominated the first quarter.
The Mechanical Engine Nobody's Talking About
Most financial media is crediting "optimism" and "earnings." That's incomplete.
According to Real Investment Advice, the real fuel behind this week's surge was pure mechanics. Commodity trading advisors — systematic trend-followers who had aggressively shorted into the March 29 lows — were forced to flip violently. Those managers bought an estimated $86 billion in equities last week alone. And per positioning data cited by Real Investment Advice, CTAs have an additional $70 billion in programmatic buying still to deploy over the next five trading sessions.
This is algorithmic forced covering at scale, not fundamental analysis driving the move.
The Iran Framework Changed the Inflation Math
Friday's session delivered the week's most consequential development. Axios reported that the US and Iran are negotiating a three-page memorandum of understanding. The framework: Iran surrenders its enriched uranium stockpile and agrees to a moratorium on nuclear enrichment. In exchange, Washington releases $20 billion in frozen Iranian funds.
Hours after that report, Iran's foreign minister posted on X that the Strait of Hormuz was open.
WTI crude dropped more than 11% on the news, according to Real Investment Advice.
An 11% crude collapse feeds directly into transportation costs, manufacturing inputs, and household energy bills. The inflation math — which had been running hot partly because of the Iran-driven oil spike — is now shifting in real time. If this deal holds, the Federal Reserve's calculus changes too.
Earnings Are Holding Up Their End
The geopolitical tailwind isn't carrying dead weight. The fundamentals are actually there.
So far, 80% of S&P 500 reporters have beaten EPS estimates by an average of 15.7%, according to Real Investment Advice, citing FactSet data. That puts us on track for a sixth consecutive quarter of double-digit earnings growth.
The big bank results were mixed but mostly strong. JPMorgan Chase beat on every line — $5.94 EPS against a $5.45 estimate, on $50.54 billion in revenue. Citigroup and BlackRock also topped estimates.
But Goldman Sachs disappointed on FICC revenue despite record equities trading, sending the stock down nearly 2%. Wells Fargo fell more than 5% on a weak print. Netflix beat on revenue and earnings but gave soft guidance — and the stock got punished for it.
Jamie Dimon Said What Everyone's Thinking
JPMorgan CEO Jamie Dimon delivered the beat — then immediately threw cold water on the party. He cut net interest income guidance and warned of what he called an "increasingly complex set of risks."
Bloomberg titled its Friday market analysis "Easy Money Has Already Been Made" — a signal that the rally has moved far enough, fast enough, that the risk-reward for new buyers is fundamentally different from what it was in March. The celebration of new highs is real, but the implication that it remains a great time to pile in is a separate question.
The IPO Window Is Cracking Open
For founders and venture investors, the rally is operationally meaningful. According to Startup Fortune, announced stock buybacks and cash takeovers have topped $1 trillion globally this year. That signals corporate boards and capital allocators believe the window is open — even with oil prices, tariffs, and Fed policy still unresolved.
Technology and AI-adjacent names have led the rally. Investors have stopped treating every dollar of AI capital expenditure as a red flag.
The IPO market is watching. If the S&P holds these levels through June, expect the pipeline to move.
The Technical Picture Confirms the Trend — With Caveats
According to StockCharts analysis, the S&P 500's medium-term Market Trend Model flipped back to bullish this week for the first time since it turned negative at the end of February. The April gap above the 61.8% Fibonacci retracement level around 6,741 was the setup. This week's all-time high was the confirmation.
The RSI moved above 60 — signaling a new accumulation phase, not just a dead-cat bounce.
But StockCharts also flags the key question explicitly: does this uptrend have staying power? Breadth indicators and the sustainability of large-cap growth leadership will answer that over the next several weeks.
What This Means for Regular People
If you have a 401(k), your balance looks a lot better today than it did in March.
But the people who made serious money on this rally bought into the panic in late March. The $86 billion in forced CTA buying is already deployed. The Iran ceasefire surprise is already priced. The earnings beats are already in the charts.
The next 5% up requires new catalysts. The next 5% down only requires the Iran deal to fall apart, one bad inflation print, or Dimon's "complex risks" to materialize.
Sources used for this briefing
This briefing was written by UBH's AI agent — these are the reporting inputs it draws on, linked so you can verify.


