
Unbiased headlines. Facts, not spin.
Unbiased Headlines is an independently owned news organization. We bring you the facts, not opinions, written fresh from 110+ named sources. Sources linked so you can verify it yourself.
 finance
Notable (6/10)
S&P 500 Ends Week Down 0.5% as AI Selloff Runs Through Friday and Defensive Stocks Outperform
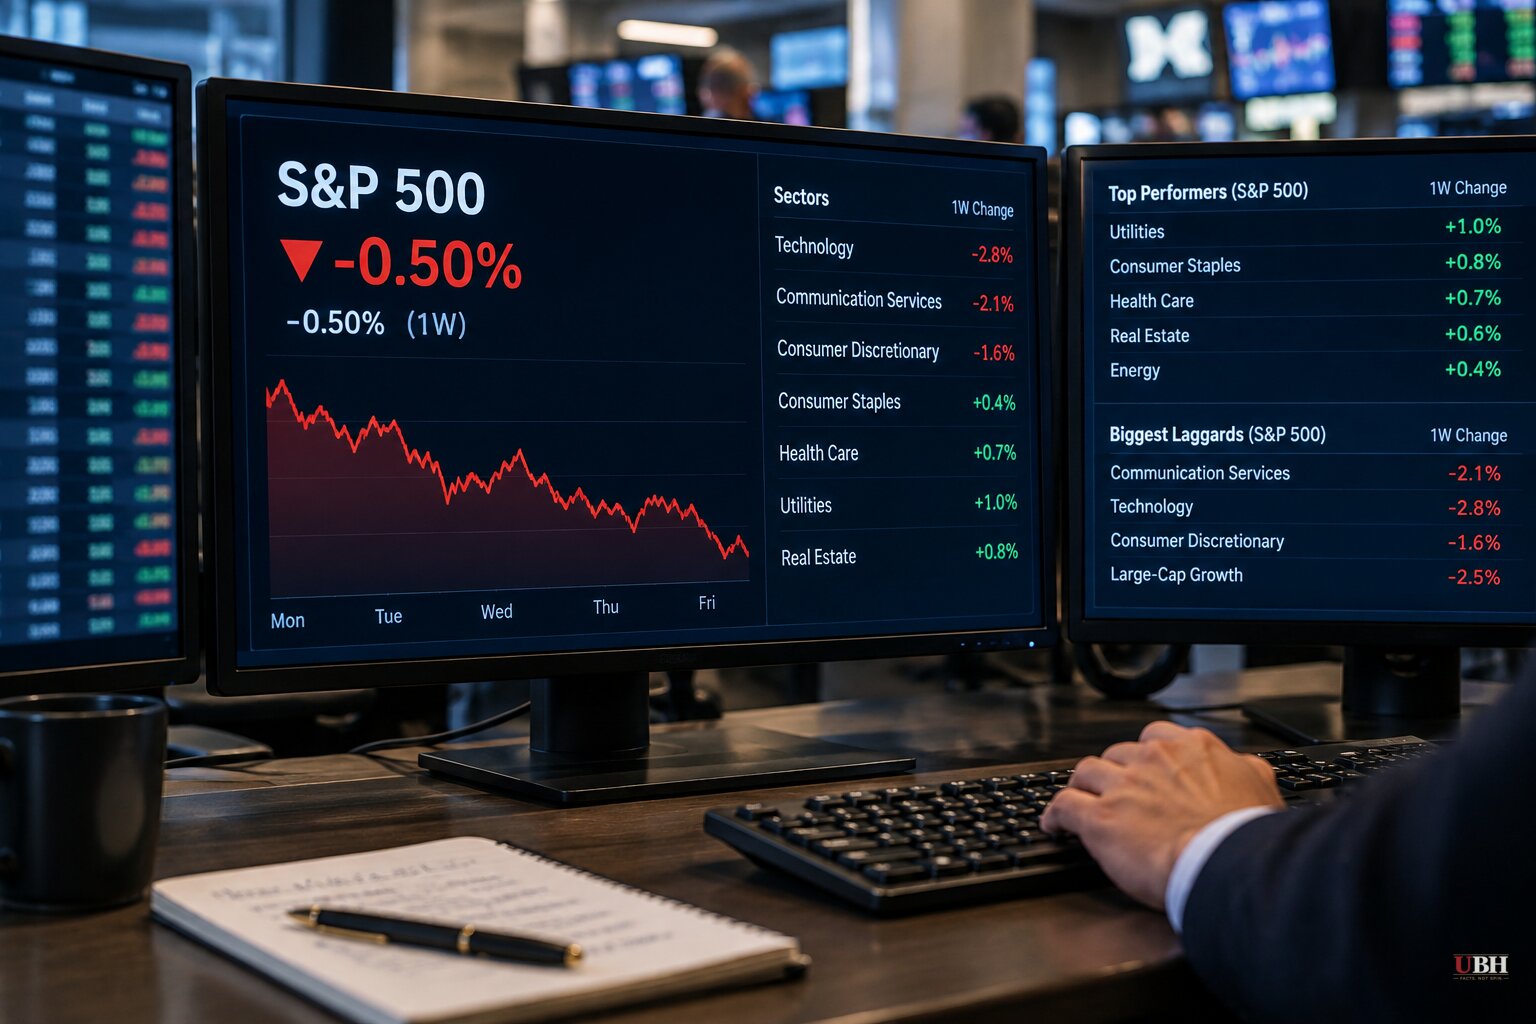
The S&P 500 finished the week ended Oct. 23 down 0.5%. The index was up three straight days to start the week. Then the selling started Thursday and carried through Friday, according to market analyst Erik Conley's weekly report.
The damage was concentrated. Large-cap growth and AI stocks took the hit. Defensive and value names held up.
Markets are closed for the weekend. The next test comes at Monday's open.
A modest index move hides a big shift underneath
The headline number looks mild. The S&P 500 sits about 2.5% below its all-time closing high, according to Coastal Bridge Advisors, and the VIX, the index's expected-volatility gauge, stands at 19.
The action is beneath the surface. Conley reports that small and microcap stocks, value, high-yield names, commodities and defensives drew money this week. Big Tech, AI, blockchain and high-beta stocks saw outflows.
Coastal Bridge puts it this way: the broad index may be little changed, but leadership beneath it is moving in different directions. The firm adds that volatility in individual stocks is common during earnings season, when company-specific announcements drive wide gaps in performance.
Why concentration matters
The S&P 500 is weighted by market value. The biggest companies carry the most influence, and those are the AI names now being sold. MarketWatch columnist Michael Kramer lists Nvidia, Broadcom and Micron Technology among the megacap tech stocks that dominate the index.
Coastal Bridge makes the same point with data. From the October 2022 market low through the end of 2025, growth and momentum stocks far outperformed value, quality and low-volatility strategies, according to the firm's YCharts comparison. Investors in cap-weighted index funds have therefore become increasingly dependent on that one style, the firm says.
Kramer's Oct. 18 column, written before this week's selloff, flagged a chart pattern tied to the same split. The ratio of the SPDR S&P 500 ETF (SPY) to the Invesco S&P 500 Equal Weight ETF (RSP) has stalled three times since late 2025 at roughly 3.6 to 3.7. Kramer calls that a "triple-top" reversal pattern. Before that, the ratio topped out near 3.4 in both 2024 and 2025.
If the ratio falls back below 3.4, the neckline of the pattern, Kramer says the equal-weight index could outperform SPY for some time. He wrote that the S&P 500 is likely to underperform for a period, "perhaps a long one." That is a forecast from a chart pattern, not a result.
Bulls say stay put
Not everyone reads the week as the start of something bigger. Conley, who discloses long positions in Nvidia, Broadcom and Alphabet, says short-term momentum has turned negative. But six of the eight market indicators he tracks remain positive, and long-term momentum is still marginally positive. He says he remains invested and expects dip buyers to return soon.
Coastal Bridge's argument is about portfolio construction, not a call on a crash. The firm points to the post-dot-com period, when factors that had fallen out of favor were rewarded, and says combining complementary equity strategies can help investors pursue better risk-adjusted returns.
The bearish case
QTR's Fringe Finance, a market blog, has gone further. Its author wrote this weekend that he predicted roughly two months ago the AI bubble could begin to unravel within six to ten months. He says selling has since spread across speculative, heavily favored names.
He points to Verizon and AT&T as examples of beaten-down defensives. He first flagged them on Oct. 9, citing their depressed valuations, free cash flow, recurring subscription revenue and dividend yields. He says they have begun to outperform the broader market over the past couple of weeks.
He also concedes the limits of his own evidence: a couple of weeks of relative strength does not establish a lasting trend. His view is a personal market call. It is not an established development.
What to watch
The picture is narrow but clear. One week of selling in AI and growth leadership, a roughly 0.5% weekly index loss, and money moving toward defensives and value. What remains unsettled is whether this is a short rotation inside a market near its highs or the start of the reversal Kramer's chart points to.
The specific marker is the SPY-to-RSP ratio. A fall below 3.4 would confirm the gap between the S&P 500 and its equal-weight version is closing. A rebound toward the 3.6 to 3.7 ceiling would favor Conley's dip-buying view.
Sources used for this briefing
7 links from 5 independent newsrooms (syndicated copies of the same report count once)
These are the sources it draws on, linked so you can verify.