
Unbiased headlines. Facts, not spin.
Every story is an unbiased news briefing written from 110+ sources across the spectrum — sources linked so you can verify it yourself.
 finance
Major Story (7/10)
June 26, 2026 at 06:34 AM
finance
Major Story (7/10)
June 26, 2026 at 06:34 AM
Gold Heads for a 5% Weekly Loss as Fed Rate-Hike Bets and a Stronger Dollar Overwhelm Safe-Haven Demand
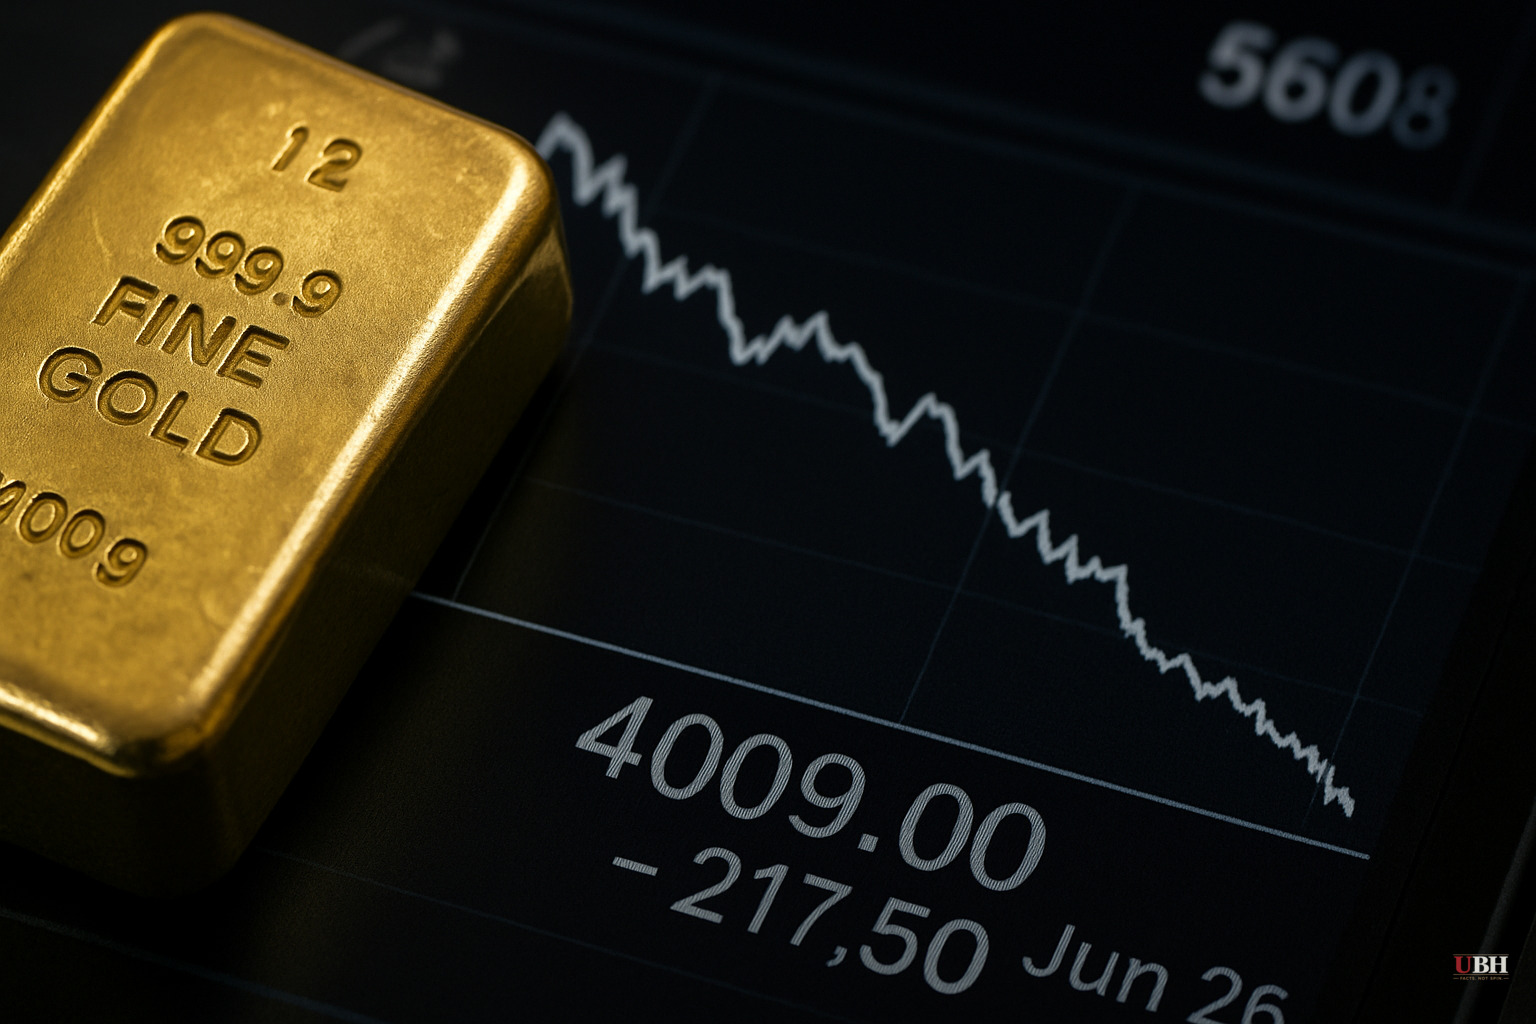
Since gold peaked at an all-time high of $5,608.35 per ounce in January 2026, the metal has shed more than 28% from that record, with the sharpest leg of the selloff arriving this week.
As of June 26, gold was trading near $4,009 per ounce on CFD markets, down about 0.45% from Thursday and on track for a weekly loss of roughly 5%, according to Trading Economics. Over the past month, the price is off 10%.
What's driving the drop
The Federal Reserve held rates steady at 3.75% at its most recent meeting, but the pause came with hawkish language that the market read as a warning sign. According to Trading Economics, futures markets are now pricing an 80% probability of a Fed rate hike by December and a 63% chance of one arriving as early as September.
Higher rates are bad news for gold for a straightforward reason: the metal pays no yield. When Treasuries or fixed deposits offer competitive returns, investors have less incentive to hold an asset that just sits there. As Sahi reported on June 25, the strengthening U.S. dollar compounds the problem because gold is priced in dollars. When the dollar appreciates, international buyers effectively pay more for the same ounce, and demand softens.
Thursday brought a brief reprieve. The latest PCE inflation data came in broadly in line with expectations, according to Trading Economics, which briefly pushed the dollar and Treasury yields lower and gave gold a modest bounce. The relief didn't last.
Oil prices falling back to pre-conflict levels as U.S.-Iran peace negotiations advanced also undercut one of gold's supports. Lower oil prices ease inflation fears, which reduces the urgency of holding an inflation hedge.
Silver is getting hit harder
Silver's decline has been more severe. According to Sahi, silver dropped to $58.44 per ounce on June 25, down roughly 16% on the week and below the $60 mark for the first time since late 2025. Trading Economics data as of June 26 puts silver at $57.33, off nearly 23% for the month.
Silver's dual role as both a precious metal and an industrial commodity can amplify moves in either direction. When risk appetite weakens globally, as it has this week with Asian tech stocks cratering, industrial-demand assumptions get repriced fast.
Stocks tied to gold took the hit too
The correction wasn't contained to the spot market. According to Sahi, shares of Hindustan Zinc fell 3.5% to ₹523.20, Manappuram Finance dropped 1.5% to ₹313.45, and IIFL Finance slid 1% to ₹519.80 as of the morning of June 25.
Gold loan companies like Manappuram and IIFL are particularly exposed. They lend against pledged gold jewelry as collateral, so when gold prices fall, the collateral backing their loan books shrinks in value. That creates credit and margin risk that equity investors price in quickly.
The bear market threshold
Sahi noted that a decline of more than 20% from a peak is widely considered the technical definition of a bear market. Gold is now more than 28% below its January record. Whether that framing applies to a commodity with fundamentally different supply-and-demand dynamics than equities is a fair debate, but the directional signal is real.
The strongest counterargument to the bearish case deserves a clear statement: gold is still 22.67% higher than it was a year ago, according to Trading Economics. Investors who bought 12 months ago are sitting on substantial gains. Central banks, especially China, which added to its gold reserves through at least March 2026 per Trading Economics data, have not stopped accumulating. And geopolitical risk hasn't disappeared. The U.S.-Iran negotiations could stall, and a single escalation event could reverse the week's losses within hours. Bulls argue the January peak was the anomaly, not the current price.
None of this changes the near-term math. A dollar that keeps strengthening and a Fed that follows through on even one more rate hike would maintain pressure on the metal.
What to watch next
Trading Economics' macro models forecast gold at $4,161 by the end of this quarter and $4,527 in 12 months, implying an expected recovery from current levels. The critical variable is whether the Fed's September meeting produces an actual hike or another pause with hawkish language. If September passes without a hike and PCE data continues to print near expectations, the rate-fear premium built into the dollar over the past month could unwind quickly. If the Fed pulls the trigger, gold's floor becomes genuinely unclear.
Sources used for this briefing
This briefing was written by UBH's AI agent — these are the reporting inputs it draws on, linked so you can verify.


