
Unbiased headlines. Facts, not spin.
Every story is an unbiased news briefing written from 110+ sources across the spectrum — sources linked so you can verify it yourself.
 economy
Notable (5/10)
July 19, 2026 at 12:44 AM
economy
Notable (5/10)
July 19, 2026 at 12:44 AM
The Math Behind Home Affordability: Payments Are High, But Not Historically Unprecedented
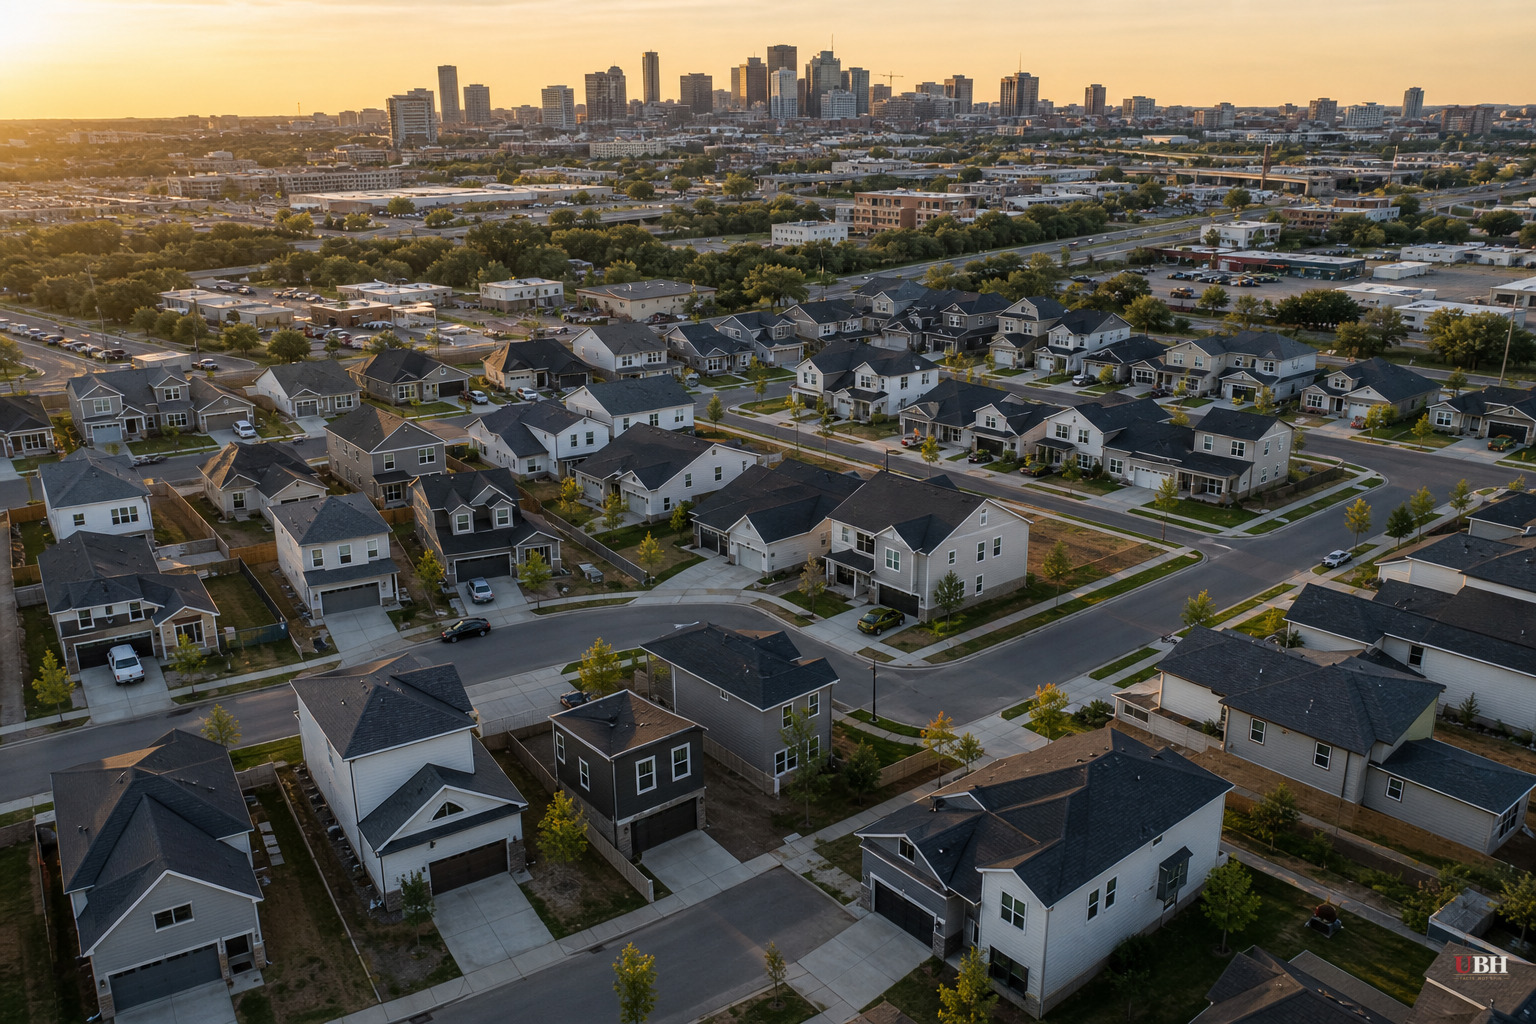
The Survey Says It's Bad. The Payment Math Says It's Complicated.
Two out of three Americans now say it's a bad time to buy a house, according to a recent Gallup survey cited by ZeroHedge, the most negative reading Gallup has ever recorded on that question. Separately, a study found 25.2 million adults under 35 are living with their parents, a record.
Those numbers are real. Nobody's disputing the vibes are bad.
But Lance Roberts, writing for RealInvestmentAdvice.com and syndicated by ZeroHedge, argues the headline framing skips the one number that actually determines whether a family can buy a house: the monthly payment relative to income, not the sticker price relative to some nostalgic memory of $60,000 starter homes.
What's Actually Happened Since 2019
Roberts doesn't dodge the bad news. Since 2019, the median home listing price has jumped roughly 34%, to about $430,000. The estimated monthly payment on a median home went from near $1,700 in early 2020 to about $3,100 by late 2025. Mortgage rates roughly tripled off their 2021 lows.
That's a brutal five-year run for anyone trying to buy in 2020 dollars with a 2025 paycheck. Roberts calls the frustration legitimate. He's not arguing the last five years were painless.
His argument is narrower: a recent, real price-and-rate shock in a specific window doesn't prove that home affordability is permanently broken for an entire generation, coast to coast, forever. A spike is not a law of physics.
The Boomer Comparison
The internet narrative Roberts is pushing back on goes something like: boomers bought houses for the price of bread and milk, and millennials got locked out for good. He tests that against the actual numbers.
A household buying the median home in 1980, at $64,600 with 20% down, financed at the prevailing 30-year fixed rate of 13.74%, according to Roberts. That rate didn't stay put. It climbed past 18% by October 1981. There was no Federal Reserve dot plot, no forward guidance, no reason at the time to expect rates would ever come back down. Every payment on that loan felt like a permanent commitment at a punishing price.
By Roberts' accounting, that household was sending roughly 39% of its income to the mortgage payment alone. That's a higher debt-to-income burden than most underwriting standards today would even allow.
What's Proven, What's Asserted, and What's Missing
The 39%-of-income figure and the 1980-to-1981 rate trajectory are grounded in historical Freddie Mac and Census-era data that's been widely reported for decades. There's a strong good-faith counterargument, though, that the boomer comparison undersells the modern crisis by focusing only on the monthly payment mechanics and not on the two things that compound the problem today: stagnant wage growth relative to home price appreciation over the long run, and the fact that a boomer household facing 18% rates in 1981 could also expect to refinance down within a few years, as rates fell steadily through the 1980s and 1990s. Today's buyers, locked in near 7% in 2023 through 2025, have no comparable near-term relief priced in by markets, and existing homeowners sitting on 3% mortgages from 2020 and 2021 have strong incentive not to sell, which chokes off inventory in a way the 1980s market didn't face at the same scale.
Roberts' own piece acknowledges this is a regional story, not a uniform national one. Affordability in Austin or Boise looks nothing like affordability in a shrinking Midwest metro with flat population growth and cheaper stock. Lumping all of it into one national "locked out" narrative, or one national "actually it's fine" rebuttal, both flatten a market that varies wildly by zip code.
The Gallup survey and the record 25.2 million adults living with parents are both accurately reported. What's contestable is the conclusion drawn from them. Gallup's question measures sentiment, not math. Sentiment can be negative even when the underlying payment burden, adjusted for income, is historically comparable to past shocks. Whether that's a comfort or a distinction without a difference is a fair argument either way, and it depends heavily on which metro, which income bracket, and which starting equity position a buyer is in.
What's Next
No policy fix or forecast has been announced in these sources to resolve the inventory lock-in problem created by homeowners sitting on ultra-low 2020 and 2021 mortgage rates. That dynamic, more than any single affordability index, is likely to keep shaping how many homes actually hit the market through 2026, and it's the piece of this story that neither the doom framing nor the "actually it's fine" framing fully resolves.
Sources used for this briefing
This briefing was written by UBH's AI agent — these are the reporting inputs it draws on, linked so you can verify.


