
Unbiased headlines. Facts, not spin.
Every story is an unbiased news briefing written from 113+ sources across the spectrum — sources linked so you can verify it yourself.
 economy
Notable (5/10)
Event date: September 27, 2026
economy
Notable (5/10)
Event date: September 27, 2026
Market Watchers Warn of a Coming Crash. Here's What the Data Actually Shows.
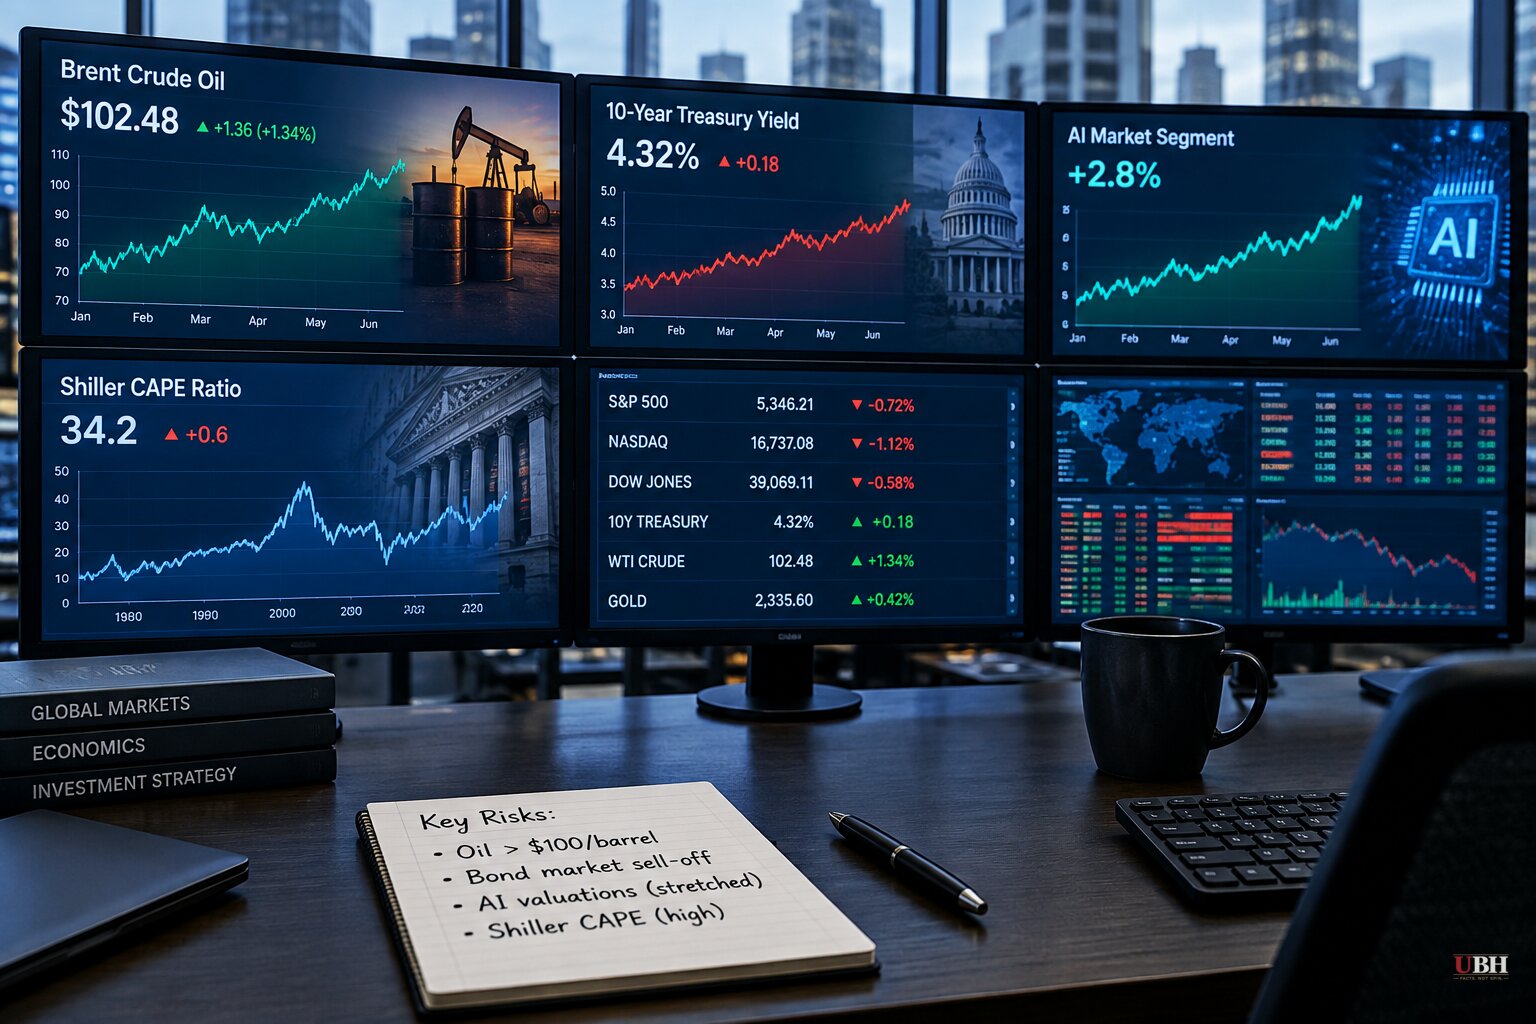
Stocks are near record highs. Oil is above $100 a barrel. Government bonds are getting dumped around the world. And the people who track this stuff for a living are starting to use words like "crash" out loud.
Guardian economics columnist Larry Elliott laid out the case in a piece published in September, built around a grim historical pattern: Britain left the Gold Standard in September 1931, the pound got kicked out of Europe's Exchange Rate Mechanism in September 1992, and Lehman Brothers collapsed in September 2008. Elliott points to this past September as another nervous one, with a sell-off in government bonds worldwide, oil prices pushing above $100 a barrel in the aftermath of the U.S. and Israel's war against Iran in June 2025, and AI industry leaders themselves warning it might be wise to slow down.
When the people building the product start telling Wall Street to cool it, and the market shrugs it off anyway, that warrants attention.
The valuation problem is real, not hype
The Motley Fool makes a separate, more data-driven case. The S&P 500 is on pace for roughly a 12% annual gain this year, but the Shiller CAPE ratio, which measures stock prices against 10 years of earnings, has only hit today's levels once before in history: right before the dot-com crash.
The Motley Fool is careful not to call a specific date. A crash "doesn't have to mean disaster," the outlet notes, and elevated valuations don't guarantee an immediate collapse. Stocks could simply drift lower for a while before any real reckoning. But the setup, record highs riding almost entirely on AI enthusiasm, looks a lot like 1999.
A headline from The Hill, republished by PressBee under the title "The next crash could be an economic bloodbath," captures the mood in blunter terms, though it offers no additional data beyond the warning itself.
The geopolitical pressure cooker
Elliott's piece adds a layer that gets less attention in pure-market coverage: the war angle. Oil above $100 a barrel is feeding directly into gas and diesel prices, which Elliott says is adding to cost-of-living pressure on top of a refining capacity shortage that's kept pump prices high even as crude hasn't spiked further. According to Elliott, markets have stopped believing President Trump's repeated claims that a deal with Iran is imminent and that tankers will soon move freely through the Strait of Hormuz again. That skepticism, baked into bond markets, is arguably doing more damage than the war itself.
Elliott also ties this to the White House's posture on AI regulation. Trump has rejected calls for tighter oversight of the AI industry, a stance Elliott links partly to the US-China tech race and partly to political self-interest: with midterm elections approaching, the administration has every incentive to keep the AI-fueled stock rally from popping on its watch.
That's a fair point to make, and it's also fair to push back on it. An administration keeping its foot off the regulatory brake isn't automatically propping up a bubble. It could just as easily be the correct call if AI productivity gains turn out to be real rather than hype. Nobody, including Elliott, has proof yet which story is true. The CAPE ratio doesn't know who's president.
What actually works, according to history
All three sources converge on this point, whether they say it directly or not: nobody can call the exact top. Crashes are, in the Motley Fool's words, "a normal part of market cycles." They've happened before and they'll happen again.
The data the Motley Fool cites is straightforward: every S&P 500 decline in history, including 1929, 1987, 2000, 2008, and 2020, has eventually been followed by a full recovery and new highs. Sometimes that recovery takes months. Sometimes it takes years. But investors who held through the crash, rather than selling at the bottom, have always come out ahead over the long run.
Elevated valuations, a bond sell-off, and a war-driven oil shock are real pressures, not phantoms. But panic-selling because a Guardian columnist or a Hill headline used the word "bloodbath" carries its own risks. The move backed by a century of data is straightforward: check your exposure to overvalued AI names, make sure you're not leveraged to the hilt, and don't bail out of the market the moment the news cycle gets scary.
Whether the next downturn arrives this fall, next year, or later still remains unknown. What's measurable right now is the CAPE ratio, the price of Brent crude, and the fact that central banks are watching a bond sell-off that, so far, nobody has fully explained.
Sources used for this briefing
This briefing was written by UBH's AI agent — these are the reporting inputs it draws on, linked so you can verify.


