
Unbiased headlines. Facts, not spin.
Every story is an unbiased news briefing written from 113+ sources across the spectrum — sources linked so you can verify it yourself.
 finance
Notable (6/10)
Event date: September 19, 2026
finance
Notable (6/10)
Event date: September 19, 2026
Institutional Stock Holdings Match 2007 Peak as Apollo Flags AI Debt Risk on Hyperscalers
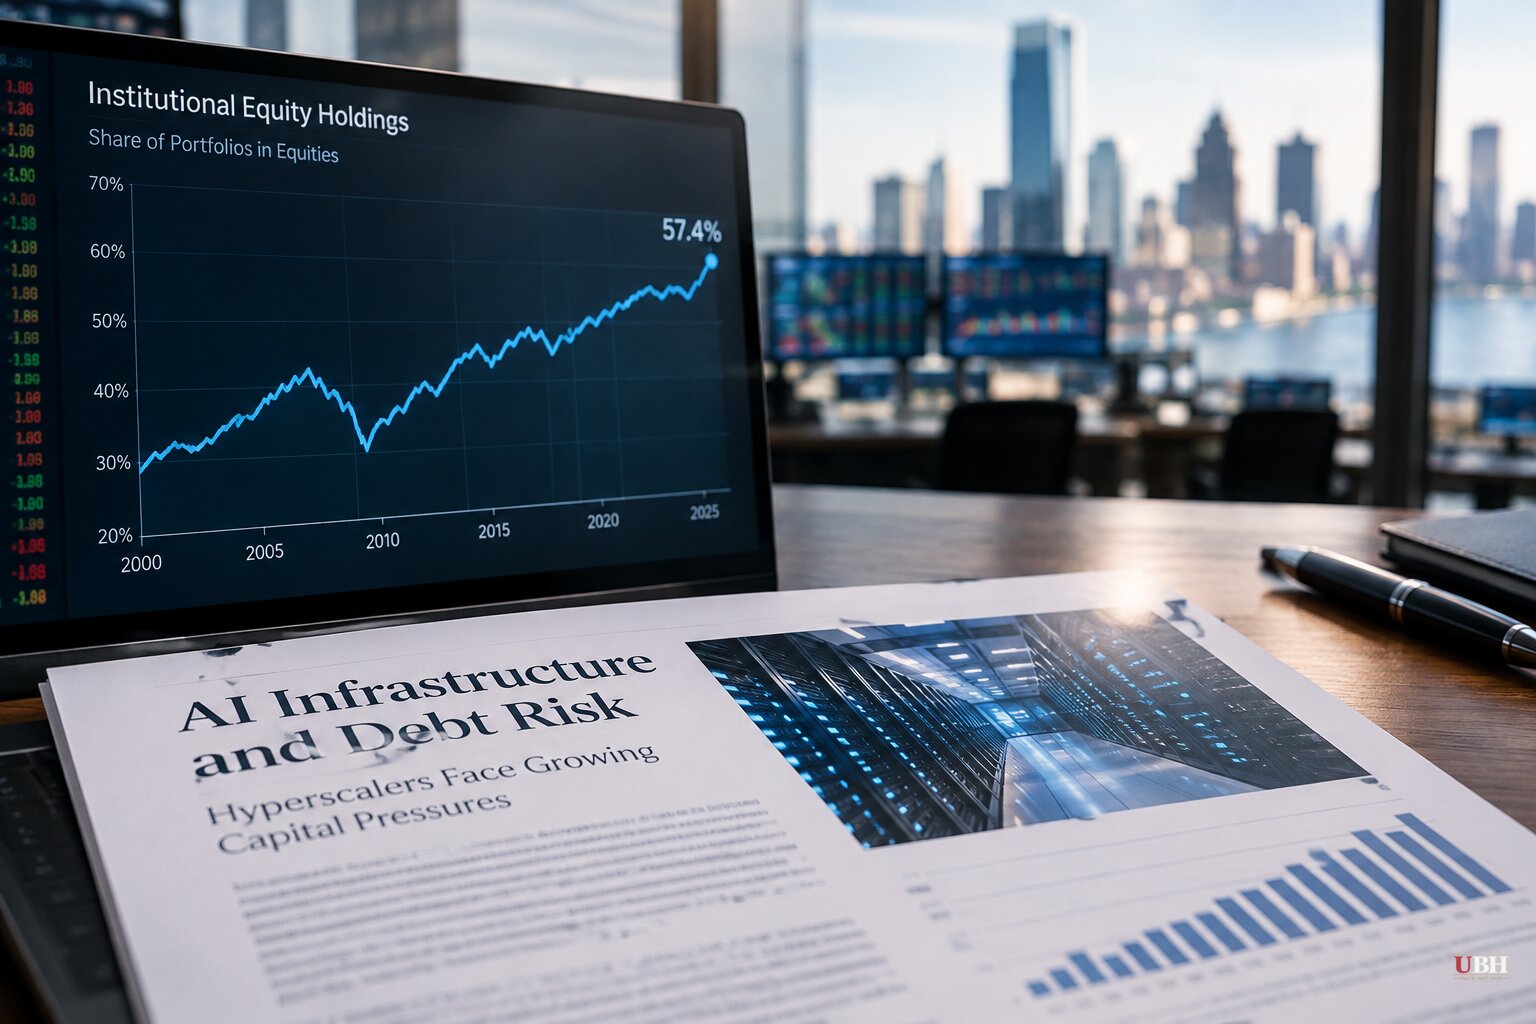
Since the S&P 500 began its climb off the 2023 lows, institutional investors have piled into stocks at a pace not seen since the run-up to the 2008 financial crisis. Data from State Street shows institutional portfolios averaged 57.4% equity exposure through August 2026, matching levels from 2007 and sitting near a 25-year high, according to CNBC.
That number alone would rattle anyone who remembers what came next in 2008. Analysts comparing the two periods, however, disagree on whether history will repeat.
Why Some Say This Bull Run Is Different
Nicholas Colas, co-founder of DataTrek Research, told CNBC the current setup doesn't resemble 2004-2006. Back then, the combined S&P 500 and Aggregate Bond Index returned 13-14%, meaning investors had to actively choose stocks over bonds to hit today's exposure levels. Now, Colas says, high equity allocations are largely a passive byproduct of returns: the S&P 500 has gained 79% over the past three years while the iShares Core U.S. Aggregate Bond ETF has returned just 1.2% over the same stretch, per CNBC. Money didn't rotate into stocks so much as it grew there while bonds sat still.
Colas also points out that the earlier high-exposure eras, 2000-2002 and 2007-2008, both coincided with major recessions or wars. He argues the period since 2023 has weathered multiple shocks without a downturn, and remains bullish despite that now being very much the Big Money view.
The Warning Coming From a Different Direction: AI Debt
While equity exposure draws 2007 comparisons, a separate 2008 echo is showing up in credit markets. Torsten Slok, chief economist at Apollo Global Management, said in a Wednesday note reported by CNBC that credit default swaps on hyperscaler debt, covering cloud giants Amazon, Microsoft, Google and Meta, have widened roughly 60 basis points against bank debt since October 2025. Slok attributes the shift to weakening credit fundamentals, not routine dealer hedging: a debt-financed AI capital spending cycle marked by rising leverage, negative free cash flow, and uncertain payback on assets that depreciate quickly.
According to FactSet data cited in Slok's note, Alphabet and Meta each carry negative forward free cash flow near $25 billion, and Amazon's runs near $30 billion. Microsoft is the outlier, remaining cash flow positive.
Dan Alpert, founding managing partner of Westwood Capital, compared the dynamic to the run-up to the 2008 mortgage crisis, though he noted banks now carry far bigger equity buffers and more diversified balance sheets than they did then. Dean Baker, founder of the Center for Economic and Policy Research, framed the widening spreads as CDS investors betting the AI companies can't deliver on the revenue growth funding their debt.
Not every analyst agrees the risk has crystallized. Paul Meeks, head of technology research at Freedom Capital Markets, told CNBC that hyperscaler margins are already improving as capacity additions slow, a sign the spending cycle may be maturing rather than spiraling. Whether Slok's warning marks an early crack or a temporary repricing depends on how fast AI revenue catches up to the spending it's funding, a question no source in this story answers definitively.
Housing Isn't the 2008 Story This Time
While Wall Street debates AI debt, the market most associated with 2008, housing, looks structurally different today. The median home sale price hit $429,000 in August 2026, according to the National Association of Realtors, with Freddie Mac putting the average 30-year mortgage rate at 6.76%.
A LendingTree survey found nearly a third of Americans are actively rooting for a housing crash to open a path to ownership. That's a fair frustration given prices this high. But the mechanism behind 2008's crash, loose lending standards and adjustable-rate mortgages that reset borrowers into payments they couldn't afford, isn't present today. Post-crisis regulation curtailed those practices. Realtor.com estimates the country is instead short more than four million housing units after nearly two decades of underbuilding since 2008, meaning today's high prices reflect scarcity, not a credit bubble waiting to pop.
Is the World Really Losing Faith in U.S. Assets?
A separate debate concerns whether foreign capital is fleeing American markets. The New York Times reported this month that global investors are growing wary of U.S. debt and the dollar amid rising deficits and sanctions policy. Treasury International Capital data released this week tells a more specific story: foreigners purchased a net $1.75 trillion of long-term U.S. securities over the 12 months through July 2026, up from $1.47 trillion the prior year and more than double the roughly $799 billion recorded in the 12 months through July 2024.
The composition shifted too. In the 12 months through July 2024, foreigners were net sellers of $151.5 billion in U.S. stocks while buying Treasurys. By the most recent 12-month period, foreign investors bought a net $941.9 billion in U.S. stocks and $452 billion in corporate bonds, while Treasury purchases slowed to $246.6 billion. That's foreign capital moving toward private-sector risk, not away from America, though it doesn't resolve separate concerns about elevated Treasury yields, which Breitbart notes have recently pushed above 5% on the 10-year.
Meanwhile, valuation skeptics see froth elsewhere. A Seeking Alpha analysis published Tuesday argued that both Valero's refining margins and Walmart's 38x forward earnings multiple are priced for conditions that may not hold, calling both companies fundamentally strong but overvalued at current levels.
Eighteen years after Lehman Brothers collapsed, the Sensex crash and Indian GDP slowdown from 8.8% to 6.7% remain a reminder, noted by the Times of India, that a U.S. credit event doesn't stay contained to U.S. markets. Whether the current AI-financed leverage cycle becomes 2008's sequel or a manageable repricing will show up first in hyperscaler earnings and free cash flow, not in the equity allocation numbers investors are watching today.
Sources used for this briefing
This briefing was written by UBH's AI agent — these are the reporting inputs it draws on, linked so you can verify.


