
Unbiased headlines. Facts, not spin.
Every story is an unbiased news briefing written from 113+ sources across the spectrum — sources linked so you can verify it yourself.
 finance
Notable (6/10)
September 25, 2026 at 12:46 AM
finance
Notable (6/10)
September 25, 2026 at 12:46 AM
Russell 2000 Sheds Six Points of 2026 Gains as Treasury Yields Rise, Options Traders Bet on More Pain
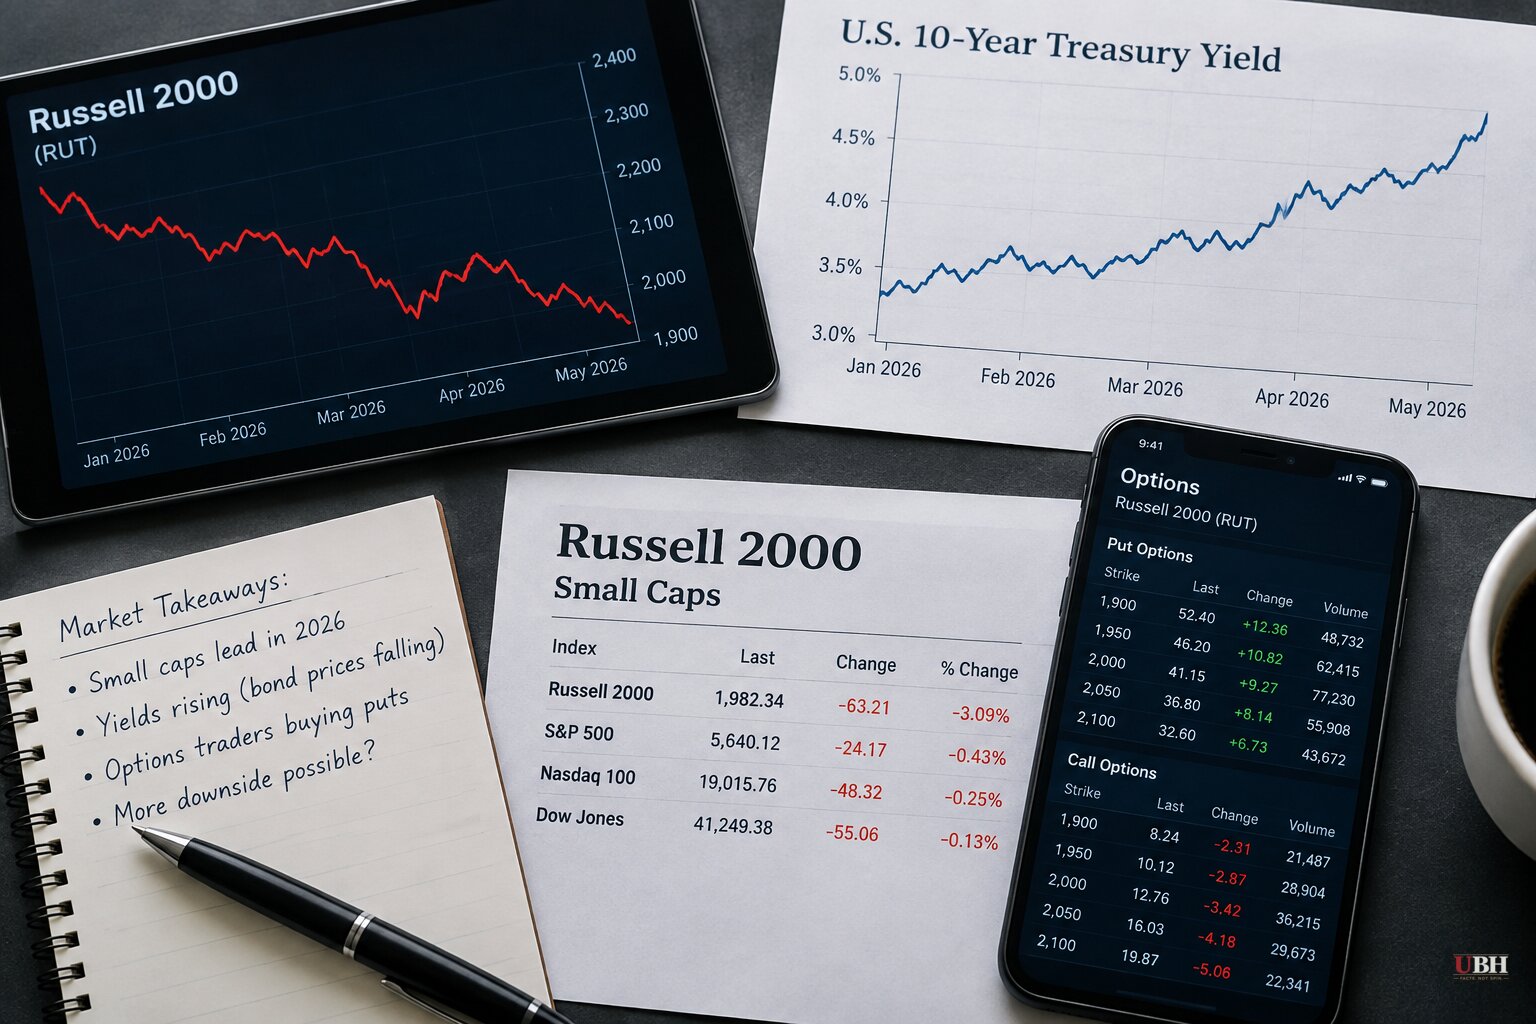
Since the Russell 2000 peaked at a 20% year-to-date gain at the start of September, small-cap stocks have shed six percentage points of return in three weeks, even as the S&P 500 keeps climbing, according to CNBC.
The index that led every major U.S. benchmark for most of 2026 is now the laggard. CNBC reports the Russell 2000 is up just 14% year to date, while the S&P 500 has jumped to a 20% gain and the Nasdaq-100 sits at 12%. At the start of the month those numbers were roughly flipped: the Russell was ahead at 20%, the S&P 500 trailed at 13%, and the Nasdaq-100 was running at 17%.
The swing traces directly to the bond market. CNBC found the correlation between the iShares Russell 2000 ETF (IWM) and the 20+ Year Treasury Bond ETF (TLT) currently sits at 0.51, more than double the 0.29 correlation between the S&P 500 fund (SPY) and long bonds, and five times the 0.1 correlation for the Nasdaq-100 fund (QQQ). Last week, the correlation between small caps and 10-year Treasury note prices spiked above 0.97, a one-year high.
Why small caps get hit harder
"Small caps have had a more difficult time adjusting to the Fed's hawkish turn and continued increase in rates at the long end, evidenced by the fact that their negative correlation to the 10-year Treasury yield is two times that of large caps," Kevin Gordon, head of macro research and strategy at the Schwab Center for Financial Research, told CNBC.
The mechanical reason is debt. Small-cap companies carry more floating-rate and shorter-maturity debt than large-cap firms, so rising long-end yields hit their borrowing costs and valuations faster. That's the same rate pressure that has been showing up elsewhere this month, including in industrial stocks that broke key technical support after peaking in August.
Options traders are positioning for more downside
The options market is leaning bearish. CNBC reports more puts traded than calls in IWM Thursday, with traders likely buying roughly 480,000 puts against 371,000 calls. Total open put interest is just shy of 7 million contracts, compared to about 3 million calls, according to Cboe LiveVol data cited by CNBC.
Of the $322 million in options premium traded in IWM that day, roughly $100 million went to buying puts versus $50 million on calls, per SpotGamma data reported by CNBC. The most heavily traded contracts were all puts: the 280- and 281-strike puts expiring that Thursday accounted for more than 120,000 trades combined, while the next-most popular contract, a 269-strike put expiring October 16, only pays off if IWM falls another 4%.
By comparison, options volume in SPY and QQQ was running about 40% above their 30-day averages by midday Thursday, while IWM volume was almost double its own average, CNBC reported. Traders appear to be concentrating bearish bets specifically in small caps rather than the broader market.
The counterargument: fundamentals haven't broken
Gordon, the Schwab strategist quoted across CNBC's reporting and echoed by Traders Union and Vibe Trader, argues the selloff is a rates story, not an earnings story. "I wouldn't discount the still-strong fundamentals that some small caps are showing," he said, pointing to continued improvement in purchasing managers' indexes, solid U.S. growth data, and forward earnings estimates for small caps that "continue to look solid."
Anyone tempted to write off the entire small-cap trade should consider this caveat. If PMI data and earnings estimates hold up the way Gordon describes, the current underperformance would be a valuation reset driven by discount rates, not a signal that small-cap businesses are actually struggling. The options positioning reflects near-term price bets, not a verdict on company fundamentals.
The bigger bond picture
The pressure on small caps isn't happening in a vacuum. The U.S. Treasury this month increased the maximum size of certain long-term Treasury buybacks from $2 billion to $6 billion, according to the Epoch Times, a move tied to managing liquidity in a bond market straining under a federal debt load now above $38 trillion. More Treasury supply and higher long-end yields are two sides of the same coin, and small caps, with their heavier reliance on debt financing, are the equity segment most exposed to that dynamic.
The open question is how far the Fed's hawkish stance and rising long-end rates go before something breaks either the bond selloff or the small-cap trade. The October 16 options expiration flagged by CNBC, where a 269-strike IWM put only pays off on a further 4% drop, is one concrete marker traders are already watching.
Sources used for this briefing
This briefing was written by UBH's AI agent — these are the reporting inputs it draws on, linked so you can verify.


