
Original briefings. Zero spin.
Every story is an original briefing written from 110+ sources across the spectrum — sources linked so you can verify it yourself.
 tech
Notable (5/10)
Event date: August 13, 2026
tech
Notable (5/10)
Event date: August 13, 2026
Kyoto Scientists Turn 1,200 SpaceX Starlink Satellites Into a Free Atmosphere Scanner
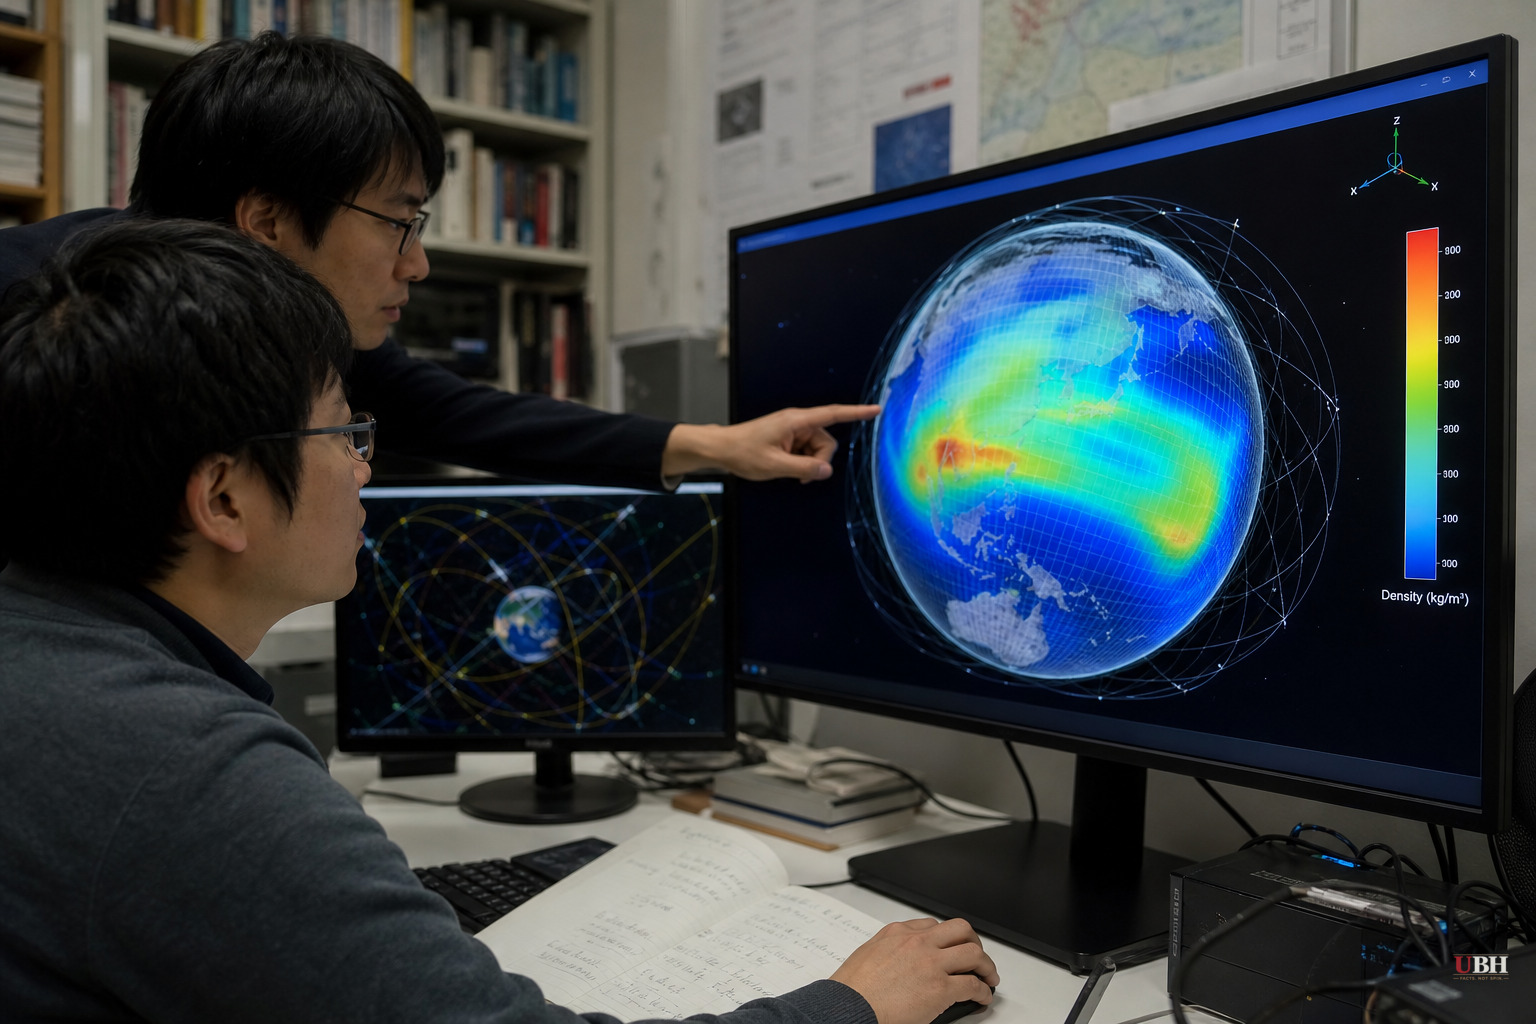
A satellite constellation built to sell broadband internet just handed atmospheric scientists a tool they didn't have to build themselves.
Researchers at Kyoto University's Research Institute for Sustainable Humanosphere, led by corresponding author Mamoru Yamamoto, used publicly available orbital data from about 1,200 SpaceX Starlink satellites to map the density of Earth's thermosphere at an altitude of roughly 482 kilometers, or 300 miles, according to Phys.org and the study published in the journal Earth, Planets and Space.
The thermosphere runs from about 100 to 1,000 kilometers above the surface. More than 99% of it is electrically neutral gas, according to Phys.org and SciTechDaily. That neutral gas doesn't interact with radio waves, which is exactly why it's been so hard to measure. The other sliver, the ionosphere, is ionized and messes with radio signals, so it's comparatively easy to track.
Nobody built a dedicated fleet to solve that problem. Yamamoto's team just looked at what was already up there.
How the trick works
Every satellite orbiting through the thermosphere hits a small amount of drag from stray gas particles. That drag slowly bleeds orbital energy and shifts the satellite's path. SpaceX publishes detailed ephemeris data on its Starlink fleet, and has since 2021 according to Hackaday. Yamamoto's team used that public data to calculate how much drag each satellite experienced, then reverse-engineered the atmospheric density around it.
Instead of stopping at individual satellite readings, the researchers applied tomography, the same math CT scanners use to build 3D images from multiple angles, according to Phys.org, SciTechDaily, and Earth.com. With roughly 1,200 satellites flying different paths, the team stitched together a full two-dimensional map of density across latitude and longitude at that altitude. Phys.org and multiple other outlets call it the first tomographic analysis of its kind.
Checked against real hardware
The results weren't just plausible-looking guesses. Yamamoto compared his map against the European Space Agency's SWARM satellites, dedicated research spacecraft that measure density with onboard instruments along their own flight paths, according to Earth.com and egamers.io. The Starlink-derived map lined up closely with SWARM's readings.
SWARM is expensive, purpose-built hardware. Starlink data is a free byproduct of a commercial internet business. Getting comparable resolution out of a constellation SpaceX built to sell Wi-Fi matters because it demonstrates the scientific value of leveraging existing commercial infrastructure.
Yamamoto's team had already done a version of this work using cruder Two-Line Element data to track how density changes over time and altitude, according to egamers.io and Hackaday. Hackaday also notes a separate 2025 paper by Zhuoliang Ou and colleagues in Remote Sensing used the same Starlink dataset and found it matched SWARM-B readings well, establishing this wasn't a one-off fluke. The new contribution is the horizontal dimension, mapping how density varies by geography rather than just by time and height.
Why this actually matters
This isn't an academic curiosity. Low Earth orbit is getting crowded. Thousands of satellites and pieces of debris now share the same neighborhood, and thermospheric drag is what determines how satellite orbits decay and when collision risks spike, according to Phys.org and brightcast.news. Solar storms can rapidly heat and expand the thermosphere, throwing off predicted orbits with little warning.
Better density maps mean better predictions for where satellites will drift, when they'll reenter, and how to plan collision-avoidance maneuvers. As more companies and countries pile hardware into orbit, that forecasting problem only gets harder.
Yamamoto put the bigger point plainly, according to Phys.org, SciTechDaily, and egamers.io, all of which carry the same quote: "This is a multidisciplinary study between space science and space engineering. Reading papers from both research fields, we realized that deeper dialogue between researchers from both fields is necessary."
The coverage here is consistent across outlets because nearly all of it traces back to the same Kyoto University release and the same published paper. Brightcast.news frames the story with a heavier emphasis on collision-risk stakes and adds an editorial note about its own mission to publish "hope"-scored journalism, which is worth flagging as framing rather than fact. The underlying science reporting, however, holds up across Phys.org, SciTechDaily, Hackaday, and Earth.com.
What's not yet resolved: whether this tomographic method can be extended to other altitude bands beyond the roughly 482-kilometer shell Starlink orbits at, and whether SpaceX or other mega-constellation operators, like Amazon's Kuiper, will keep publishing the kind of granular orbital data that made this analysis possible in the first place. If commercial operators ever decide that data has competitive value and start restricting access, researchers lose their free scanner.
Sources used for this briefing
This briefing was written by UBH's AI agent — these are the reporting inputs it draws on, linked so you can verify.


