
Original briefings. Zero spin.
Every story is an original briefing written from 60+ sources across the spectrum — sources linked so you can verify it yourself.
 tech
Low Interest (3/10)
August 8, 2026 at 01:01 AM
tech
Low Interest (3/10)
August 8, 2026 at 01:01 AM
EU's Free Copernicus Satellite Tool Adds One-Click Wildfire Layer
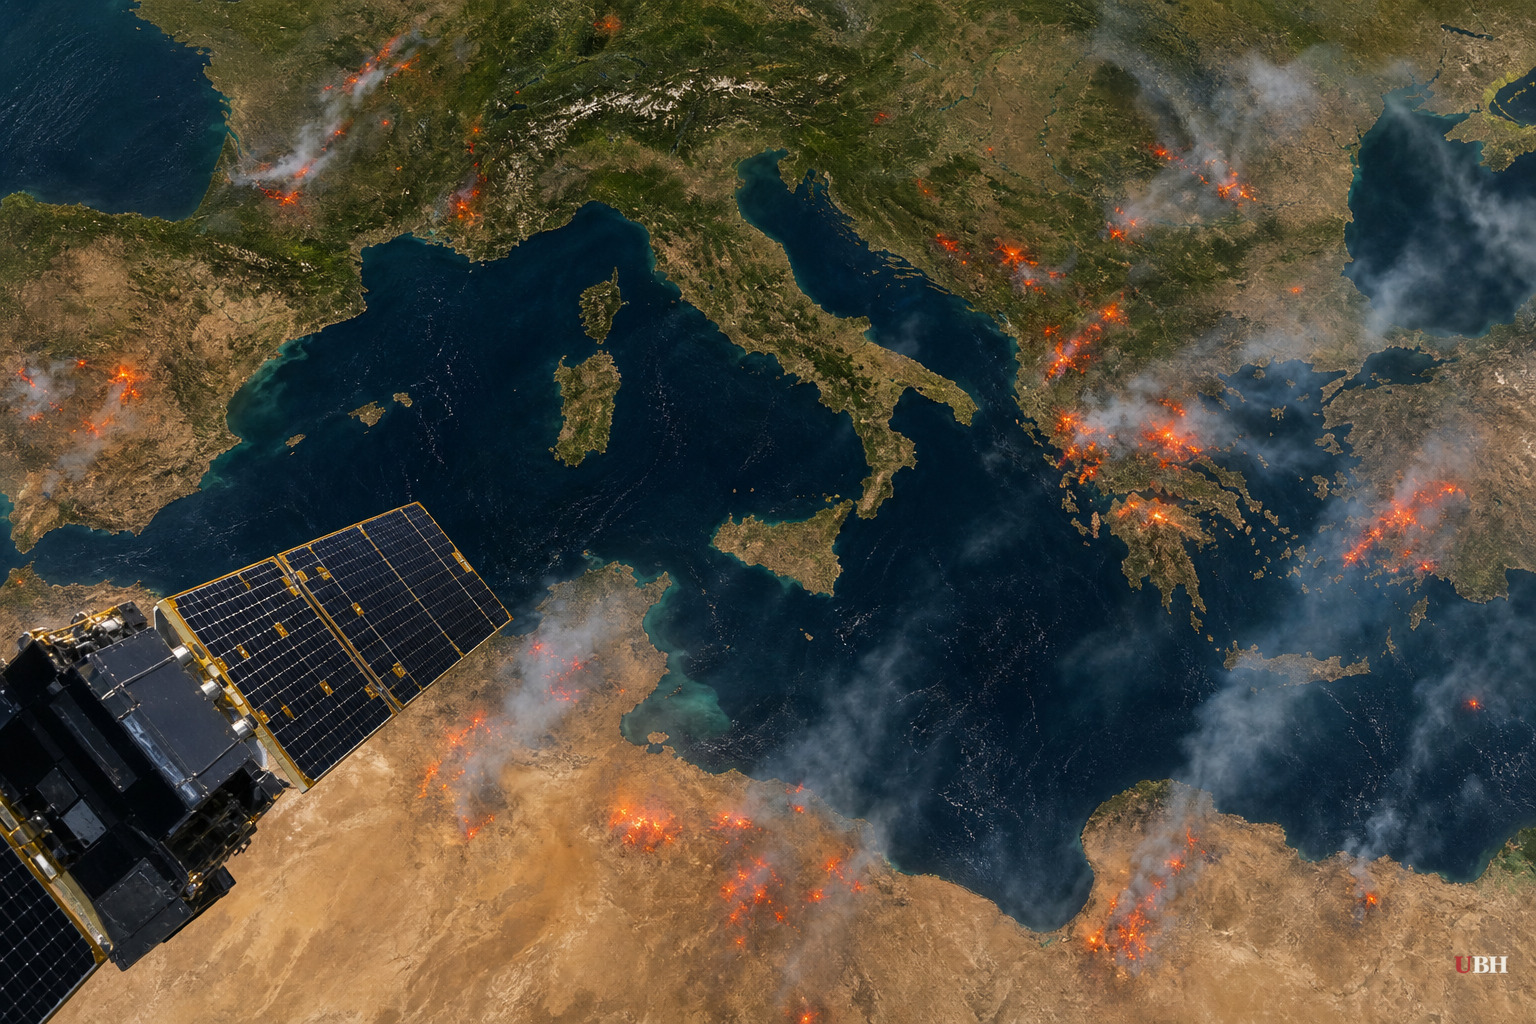
Anyone with an internet connection can now pull up satellite imagery of a wildfire and instantly see what's burning, what's already burned, and what's still at risk. No coding required.
The European Union's Copernicus Browser, a free satellite imagery service running on European Space Agency data, added a default "wildfires" visualization layer for its Sentinel-2 imagery on August 4, according to Ars Technica. Click the layer over a fire zone and active fires show up white or yellow, burning vegetation shows red, and scorched ground appears dark brown or black.
This isn't new technology. The underlying script was written years ago by remote sensing expert Pierre Markuse, who combined red visible light, near-infrared, and short-wave infrared bands to separate healthy vegetation from burned land and reveal soil moisture, according to Geovisualization as cited by Ars Technica. Until now, users had to manually copy and paste that code into the Copernicus Browser's custom visualization tool to use it.
Simon Proud, a mission scientist for Sentinel-2 at the European Space Agency, pushed to get the script built into the browser as a standard option instead of a manual workaround. He announced the change had gone live in a Discord channel run by the investigative journalism outlet Bellingcat, according to Ars Technica.
Why the resolution matters
The Sentinel-2 satellites capture imagery down to 10-meter resolution in the relevant bands. That's a meaningful upgrade over NASA's FIRMS tool, which offers free global fire detection updated within hours but tops out at 250-meter resolution, according to Ars Technica.
The tradeoff: Sentinel-2 imagery only updates every few days, not every few hours. So NASA's tool wins on speed, Copernicus wins on detail. Journalists, researchers, and open-source investigators tracking fires or conflict zones now have both options for free, without a subscription or a data request.
The backdrop: a rough fire season
The timing lines up with active fire activity across multiple continents. Washington and Oregon are dealing with wildfires and smoke, according to Ars Technica. Canada's wildfire season is on pace to be one of its worst on record. Firefighters in other regions are still working active blazes as of this reporting.
Ars Technica frames the tool's arrival against the backdrop of climate change worsening fire seasons generally. Dry conditions, heat, and fuel buildup are well-documented drivers of fire severity, and fire seasons in the Pacific Northwest and Canada have trended more intense in recent years. The mapping tool upgrade is distinct from questions about fire causation, even as broader climate trends provide context.
What's actually new versus what's just easier
The capability to visualize fires this way has existed for years through the manual script. What changed on August 4 is accessibility. A non-technical user, a local reporter, a volunteer firefighter, a curious homeowner can now click one button instead of hunting down and pasting in custom code.
This represents an improvement in a public tool funded by European taxpayers through the EU's Earth observation program. Making government-funded data genuinely usable by ordinary people, rather than locking it behind technical barriers, provides a transparency benefit regardless of who built it.
What's unresolved
Copernicus Browser's imagery still lags NASA FIRMS on update speed, so anyone needing real-time fire location data during an active, fast-moving blaze will still lean on NASA's coarser but faster tool. The two systems are complementary, not competitors.
No word yet on whether NASA or other national space agencies plan similar one-click visualization defaults for their own public tools. For now, the most detailed free wildfire imagery available to the public updates every few days, not every few hours, a limitation anyone using it for real-time emergency response needs to keep in mind.
Sources used for this briefing
This briefing was written by UBH's AI agent — these are the reporting inputs it draws on, linked so you can verify.

