
Unbiased headlines. Facts, not spin.
Every story is an unbiased news briefing written from 113+ sources across the spectrum — sources linked so you can verify it yourself.
 finance
Major Story (8/10)
Event date: September 24, 2026
finance
Major Story (8/10)
Event date: September 24, 2026
10-Year Treasury Yield Hits 5.2%, Highest Since 2007, as Curve Flattens Toward Inversion
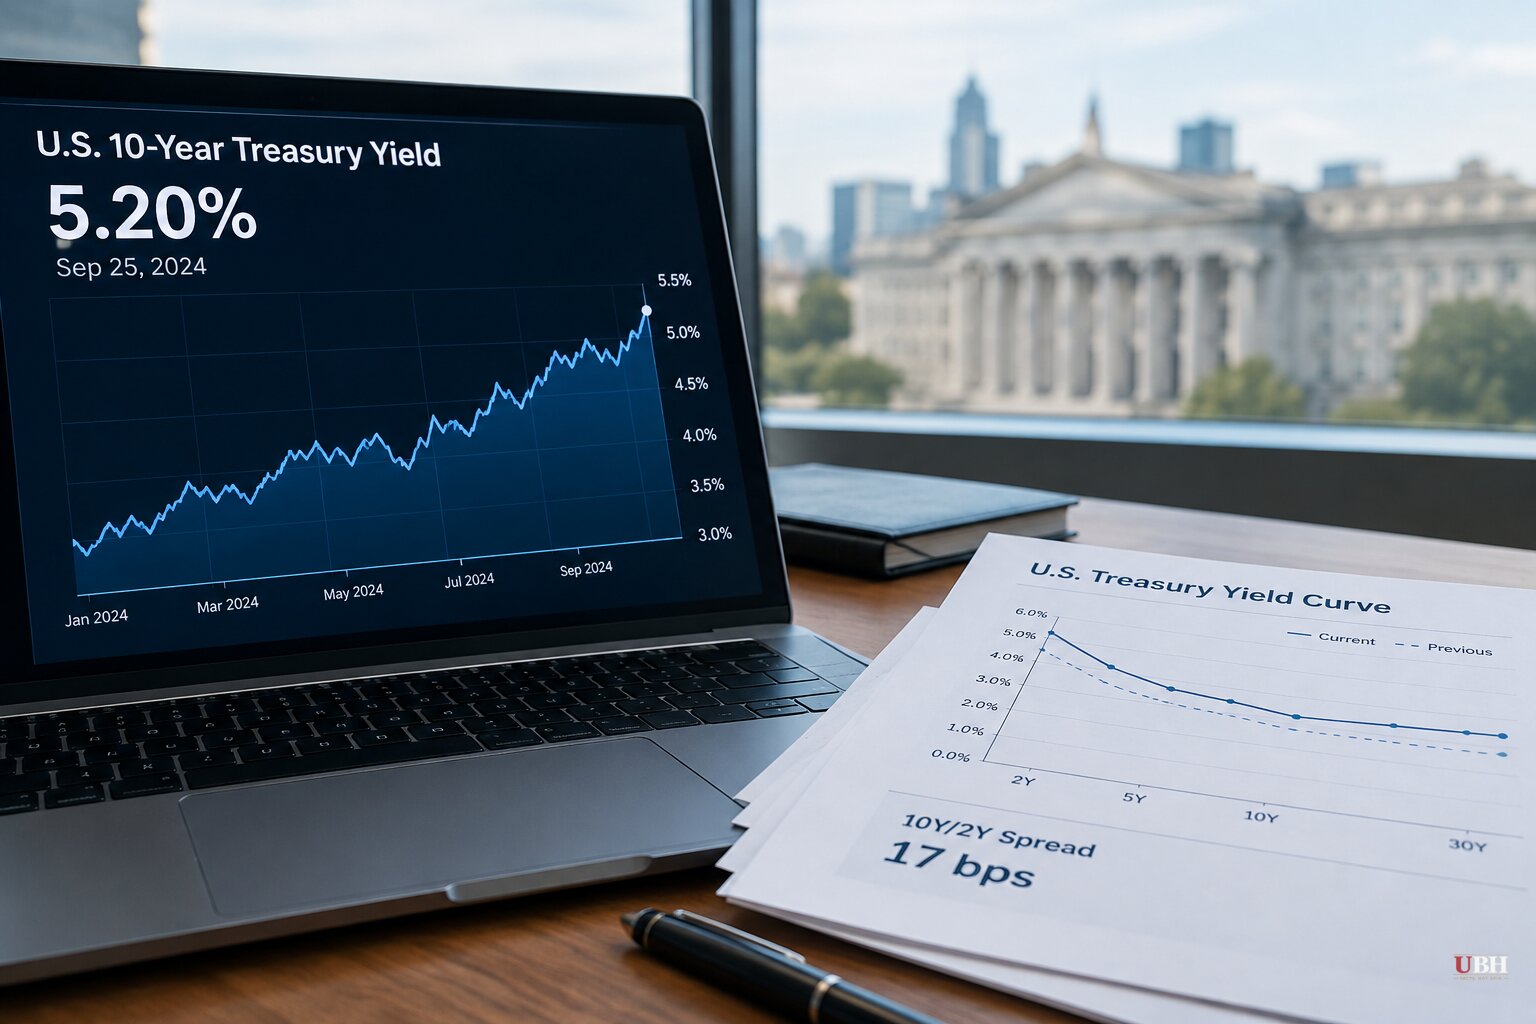
Since Treasury yields began climbing off their post-pandemic lows, the move has accelerated sharply in recent weeks. On September 25, the 10-year Treasury yield touched 5.2%, its highest level since June 2007, according to The Epoch Times. The 30-year bond yield has been hovering around 5.5%, a level not seen in more than two decades.
The short end of the curve is moving too. Benzinga reported that the one-year yield sits at a 25-month high, the two-year at a 28-month high, and the five-year, 10-year, and 30-year yields are all at 19-year highs. The 20-year yield is at a 22-year high.
The Flattening Curve
The spread between the 10-year and 2-year yield, watched closely because an inversion has preceded past recessions, narrowed to as little as 17 basis points last week, the tightest gap since early 2025, according to Bloomberg. Separately, 24/7 Wall St. reported that as of September 26 the spread had widened 5 basis points to +0.36 percentage points, bouncing off what it called 2026's flattest reading, with a recent low around +0.20 percentage points. The two figures come from different days and methodologies, but the takeaway is the same either way: the cushion between a normal curve and an inverted one is thin, and it has been shrinking most of the year.
What's Driving It
The simplest story, laid out by The Motley Fool, points to three forces: inflation that has stayed above the Federal Reserve's 2% target for more than five years, a national debt that recently crossed $40 trillion and will keep requiring more bond issuance to cover deficits, and corporate borrowing tied to artificial intelligence buildouts, with capital spending among the top five hyperscalers projected at roughly $800 billion this year. That combination, the outlet argues, is pushing investors to demand more compensation to hold both government and corporate debt.
A fiscal-hawk concern here: if the government keeps running large deficits and flooding the market with new debt, basic supply and demand says yields have to rise to attract buyers, regardless of what the Fed does. A $40 trillion debt load is a real number, not a talking point.
But a Breitbart column citing new research from economists Paul Beaudry, Paolo Cavallino, and Tim Willems complicates that story. Their VoxEU analysis found that three-day windows around monthly payroll reports and Fed official speeches, just 23.9% of trading days, accounted for 90.5% of the rise in the 10-year yield and 81% of the rise in expected short-term rates over the next decade. Their reading: markets have mostly been repricing how high the Fed will keep rates, not rendering an independent verdict on debt or deficits. That is a genuinely different explanation than the debt-vigilante narrative, and the sources don't reconcile the two.
Mohamed El-Erian, quoted by Benzinga, split the difference. He said the drivers—government and tech-sector borrowing, Fed signaling of a stronger economy, and geopolitical uncertainty including the unresolved endpoint of the Israel-Iran conflict—have all been visible for some time. His argument is that traders are reacting less to new information than to "psychological anchoring" after more than a decade of artificially low, post-2008 rates. He's not saying the worry is fake. He's saying it shouldn't be a surprise.
The Fed's Role
The Fed already raised rates in September, a move Fed Governor Michael Barr defended in a September 23 speech, saying the central bank had been "out of position" and made "an adjustment in the right direction." Barr said further hikes are likely given persistent above-trend inflation. Cleveland Fed President Beth Hammack said on September 24 that the labor market is close to her definition of maximum employment.
CME FedWatch data put the odds of a back-to-back quarter-point hike at the October Federal Open Market Committee meeting at 69%, according to The Epoch Times. That's a market-implied probability, not a done deal. The Atlanta Fed's GDPNow model is projecting 5% third-quarter growth, also a model estimate, not a reported figure. Last month's durable goods orders came in flat versus a consensus forecast of a 0.4% decline, according to the same report, which Reflexivity's Giuseppe Sette called evidence the economy is in "an extremely ebullient growth phase."
Stocks Are Still Up, For Now
Despite the bond market turbulence, the S&P 500 has advanced roughly 12% to 13% year-to-date and the Nasdaq Composite has gained 15% to 16%, per The Motley Fool and Benzinga. On a recent Wednesday session, the SPDR S&P 500 ETF fell 0.72% to $767.81 and the Invesco QQQ Trust fell 0.84% to $741.21, Benzinga reported, both modest single-day pullbacks rather than a rout.
Benzinga also noted that the last time the 10-year yield hit this level, July 2007, the global financial crisis began three months later, and the Nasdaq lost 56% of its value over the following 16 months. El-Erian's own framing pushes back against treating today's move as a 2007-style shock.
Washington Post opinion writer Ross Clark drew his own parallel, invoking James Carville's old line that everyone should fear the bond market, and argued that rising yields in Britain and the U.S. are a warning that the Trump administration isn't heeding. That's an opinion argument, not a reporting claim, and the sources here don't detail any specific administration response to the yield move.
The open question is which explanation the next few weeks of data settle: whether the October Fed decision, expected around the FOMC's scheduled meeting, calms the curve or pushes it toward the inversion investors are watching for.
Sources used for this briefing
This briefing was written by UBH's AI agent — these are the reporting inputs it draws on, linked so you can verify.


