
Unbiased headlines. Facts, not spin.
Unbiased Headlines is an independently owned news organization. We bring you the facts, not opinions, written fresh from 110+ named sources. Sources linked so you can verify it yourself.
 finance
Notable (5/10)
XRP Falls Below $1 for First Time Since August After Nine-Day Slide
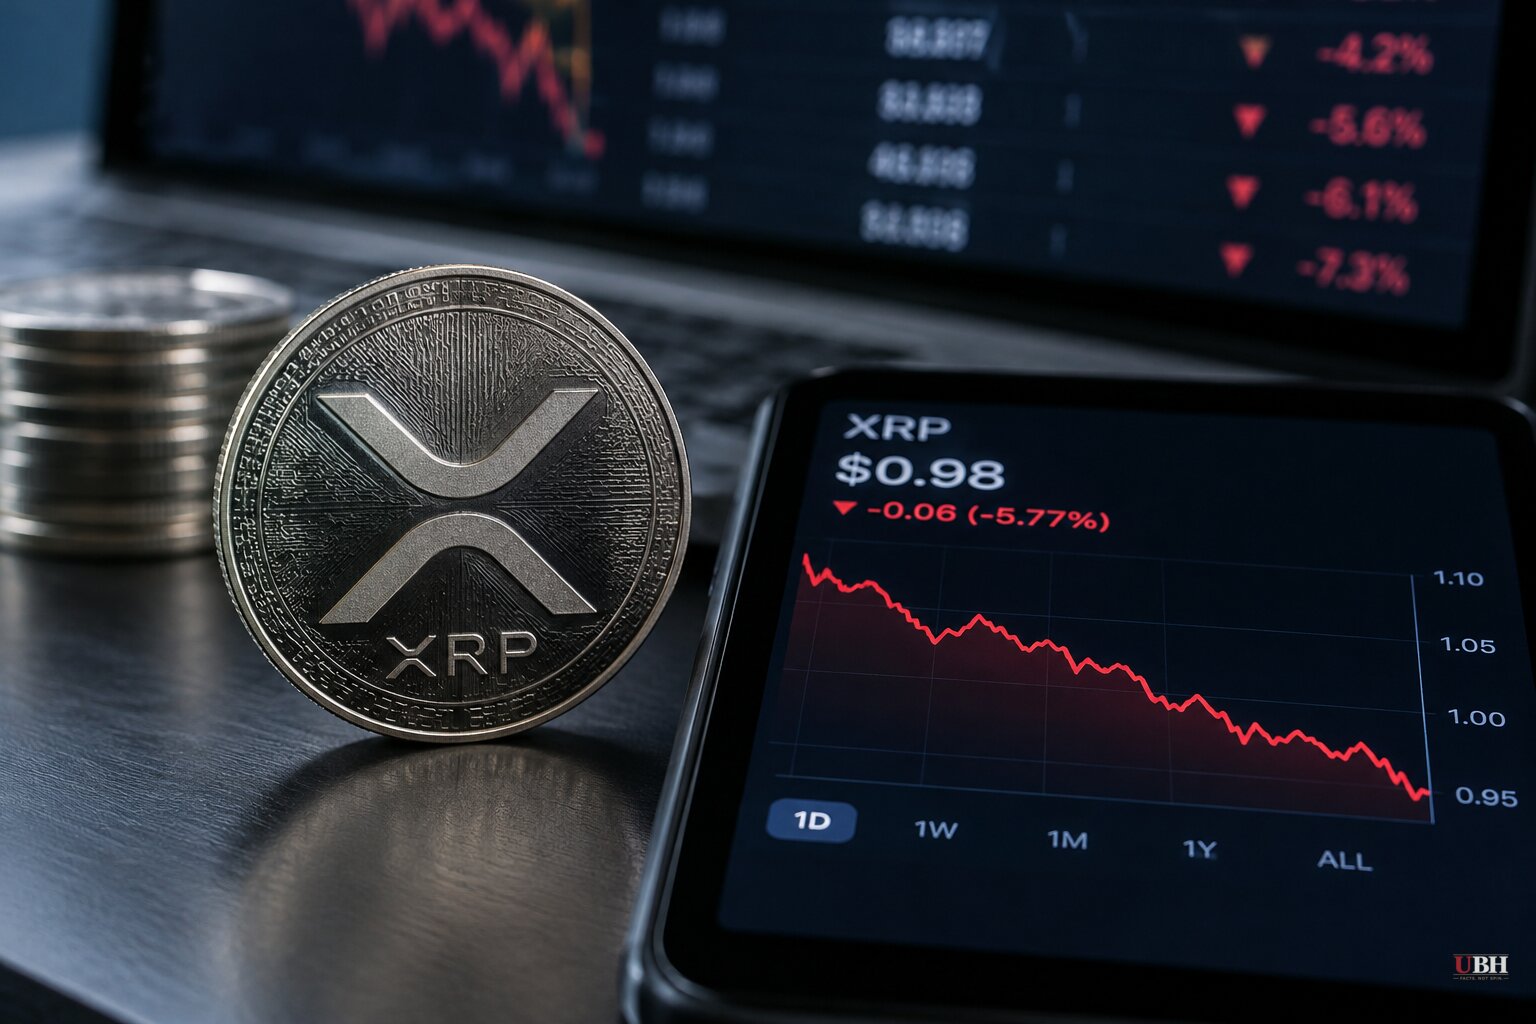
XRP traded below $1 on Friday, Nov. 13, for the first time since August. The dip capped nine straight daily declines that began Nov. 5.
The token opened November near $1.30 and closed around $1.04 on Nov. 12, according to Binance daily figures. It is down about 38% from its October high near $1.60.
Over 30 days, XRP is down 28%. For the year, it is down 47.9%. It sits 73.7% below its all-time high of $3.65, set in July 2025.
How far it fell depends on the feed
The exact low differs by venue. TradingView data showed XRP touching $0.9974 on Friday before buyers pushed it back toward $1.02. Other readings put the intraday bottom at $0.9818, $0.972 and, on one tracker, about $0.956.
By early Saturday, Nov. 14, the token was changing hands around $0.986 to $0.992. It had dropped as low as $0.972 in early trading that day.
If Saturday's daily candle closes lower, that is ten consecutive declines. It would be the longest such streak since early 2026.
What pushed it down
Leverage did some of the damage. CoinGlass data showed roughly $16.9 million in XRP positions liquidated over 24 hours. Futures open interest was still near $2.12 billion, which means plenty of leveraged exposure is left to unwind.
US spot XRP ETFs also bled. They recorded about $19.13 million in net outflows between Nov. 9 and Nov. 13, based on SoSoValue figures. The biggest single day was Nov. 9, with roughly $10.42 million out. Another $7.62 million left on Nov. 10.
Total ETF assets fell to about $1.14 billion, from $1.51 billion in late October. Cumulative net inflows since launch remain around $1.71 billion.
The wider market was no help. Bitcoin slid under $70,000 as technology shares weakened and traders reassessed the Federal Reserve's path. The Crypto Fear & Greed Index read between 13 and 20, which is "Extreme Fear."
The dollar added pressure. The U.S. Dollar Index rose Friday to its highest level since April 2025 after higher-than-expected inflation data earlier in the week. A KuCoin market analysis also pointed to concerns over leadership turmoil at Nvidia weighing on AI-related trading.
XRP has also lost ground in the rankings. CoinMarketCap data showed it sixth by market capitalization at $62.72 billion, behind the USDC stablecoin. The token fell nearly 16% on the week.
Big holders are buying
Small traders were not the only ones active. Santiment data showed wallets holding at least 10,000 XRP reached about 343,500 in November, up 16,815 (5.15%) from nine months earlier.
Wallets with at least one million XRP hit a 2026 high of 2,147. Over the past seven weeks, the price has dropped more than 30% while those wallet counts have risen.
That divergence does not mean a floor is forming. Wallet counts show who is holding. They do not show who is selling into the weakness or how long the buyers plan to stay.
Pro-XRP lawyer Bill Morgan says the drop is typical of a market still driven by Bitcoin. He argues that XRP's nearly 13-year run in the top 10 by market capitalization is the more remarkable fact. XRP has now slipped out of the top five, though it remains in the top 10 at sixth.
Levels traders are watching
Analysts cited in TradingView's analysis flag $0.95 to $1.00 as the key demand zone. A recovery above $1 would first meet resistance at $1.20 to $1.25. A sustained break above that range would bring $1.55 to $1.60 back into view.
On the downside, a decisive break under $0.95 could expose $0.90, and then the $0.80 region, roughly 19% below $0.99. The weekly Bollinger Band floor sits near $0.90. The August 14 low around $0.9862 is another reference point.
A Santiment-based scenario in the KuCoin analysis goes further. If $1 fails and the whale buying reverses, XRP could drop to $0.77, a level last seen in October 2025. If $1 holds and Bitcoin stabilizes, the same analysis sees a path back to $1.10 to $1.15.
Those are projections from analysts, not outcomes. Nobody in the data has shown XRP will hold or lose any of these levels.
What comes next
The immediate question is whether XRP logs a completed daily close below $1 this month. As of the Nov. 12 close near $1.04, the selloff had not produced one.
Saturday's close will settle whether the streak reaches ten. Next week's ETF flow data will show whether the outflows of Nov. 9 and 10 were a blip or the start of a trend.
Sources used for this briefing
7 links from 7 independent newsrooms (syndicated copies of the same report count once)
These are the sources it draws on, linked so you can verify.